
Fig. 3. Protein changes as a result of treatment with BMS-754807 and metformin combination.
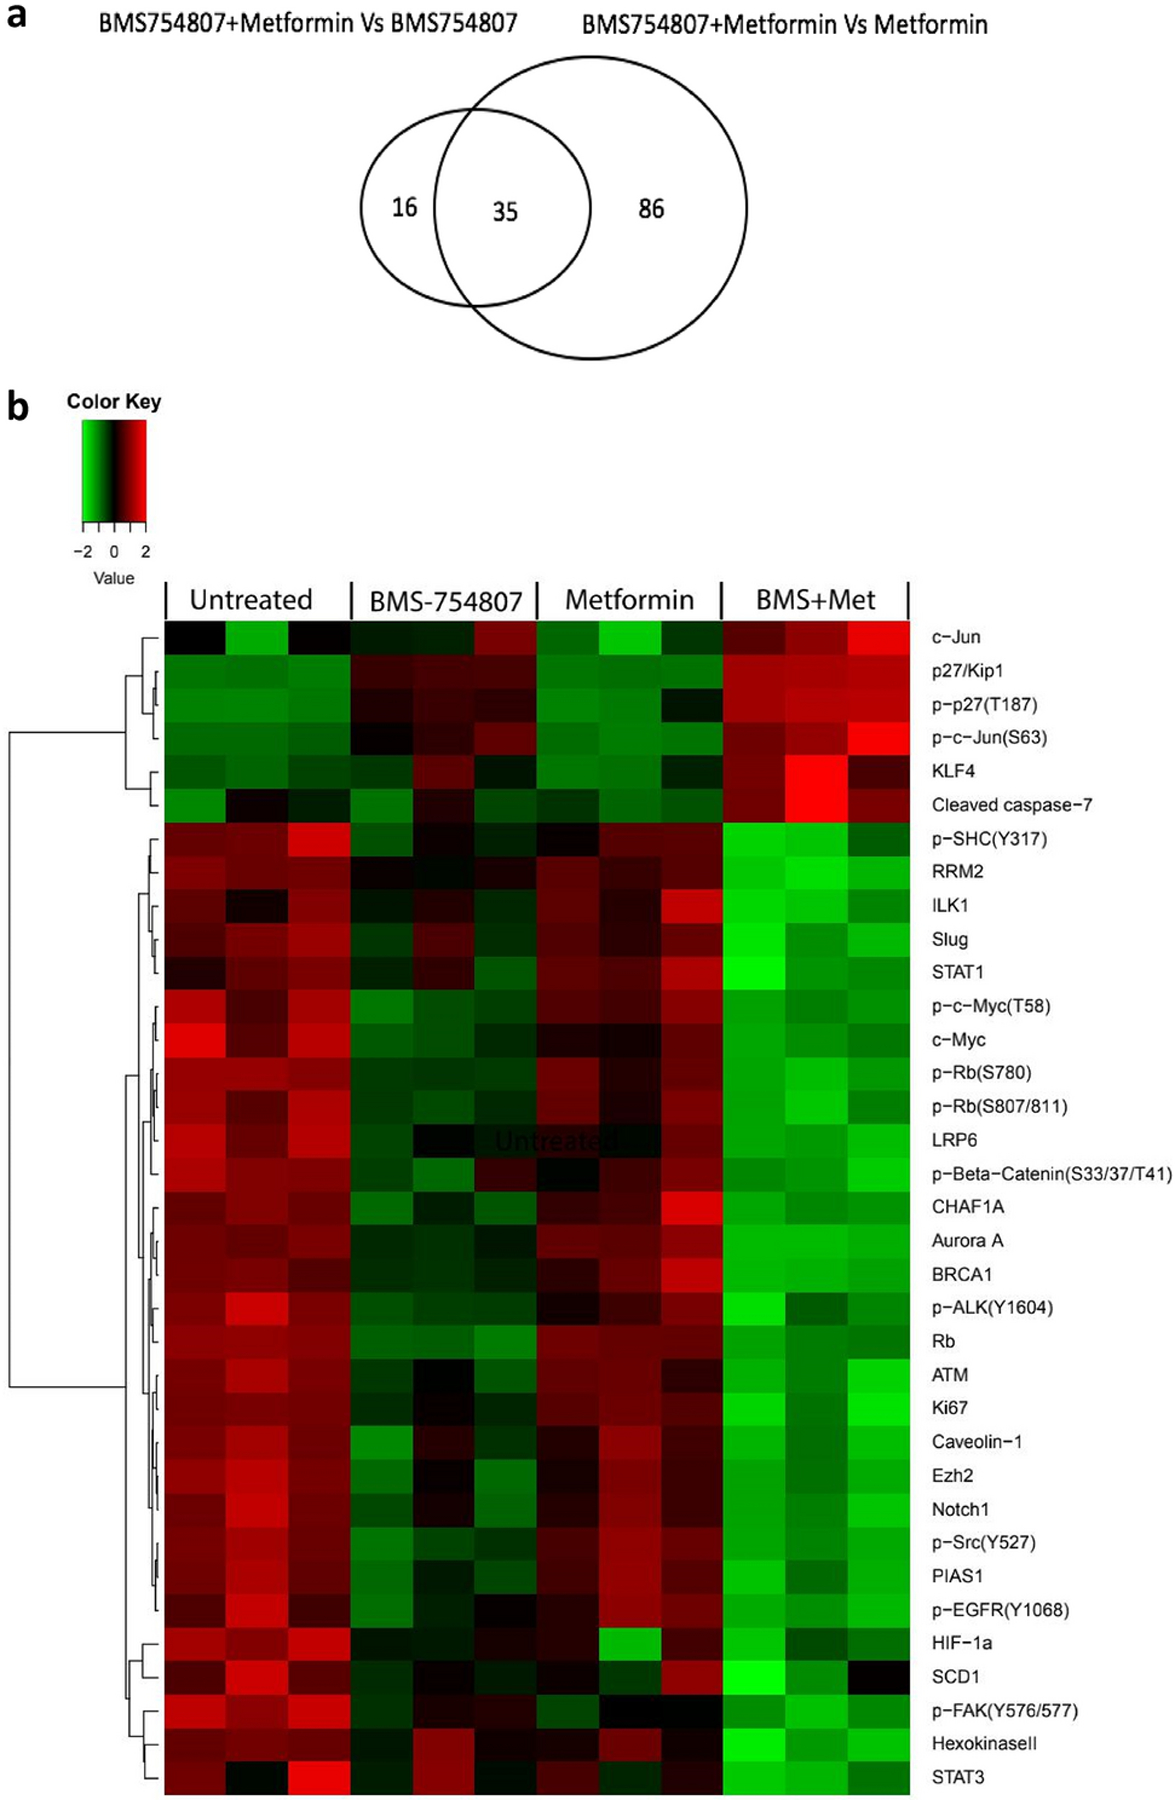
(a) Venn diagram showing the numbers of proteins in the listed comparison. (b) Heatmap from RPPA analysis showing proteins/phosphoproteins differentially expressed in HCC1806 following treatment with DMSO, metformin alone, BMS-754807 alone, and the drug combination. The normalized data were log2 transformed. There are 4 groups and each group has 3 biological replicates. For each sample, the median value of the three technical replicates was used for statistical analysis. Two-way ANOVA was used to test the main effects of the different treatments and their interactions. A p value < 0.05 was considered statistically significant. Red indicates higher intensity while green which indicates lower intensity.