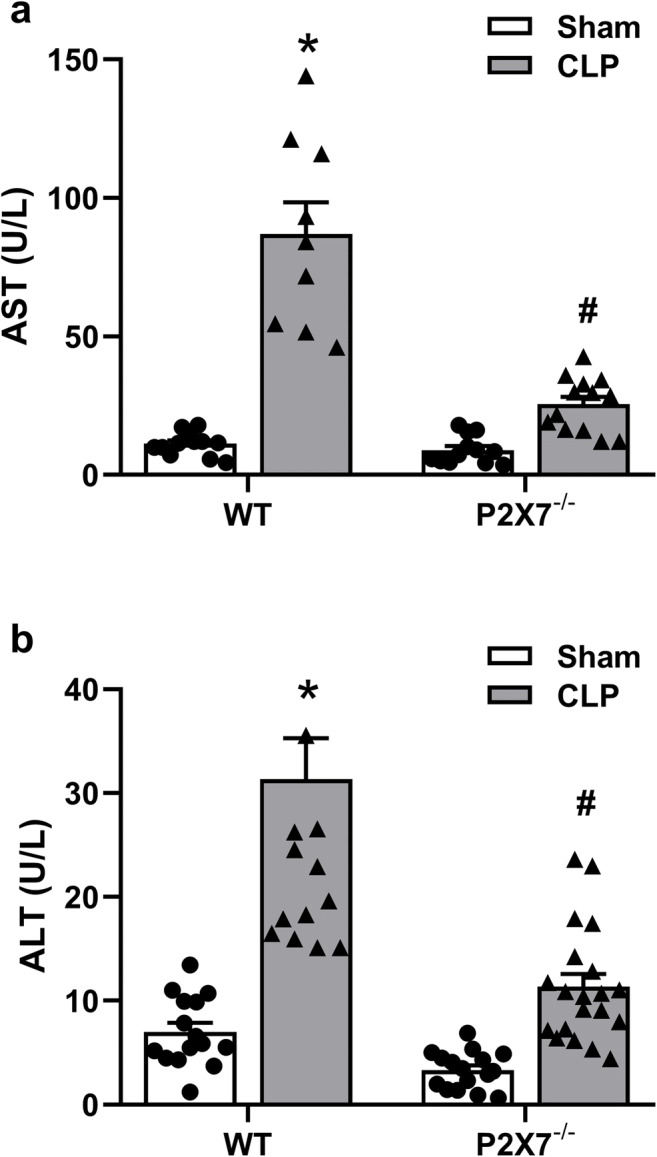
Fig. 2.

AST and ALT in the serum of WT and P2X7−/− animals 24 h after sepsis induction. Serum AST in WT (left (a)) and P2X7−/− (right (a)) mice. Serum ALT in WT (left (b)) P2X7−/− (right (b)) mice. The asterisk represents statistical difference (*p < 0.05) when compared to sham groups with their respective CLP group, while the number sign represents statistical difference (#p < 0.05) when compared to CLP groups (WT CLP vs. P2X7−/− CLP). Data were analyzed by two-way ANOVA and they are expressed as mean + S.E.M. (n ≥ 10 animals per group)
