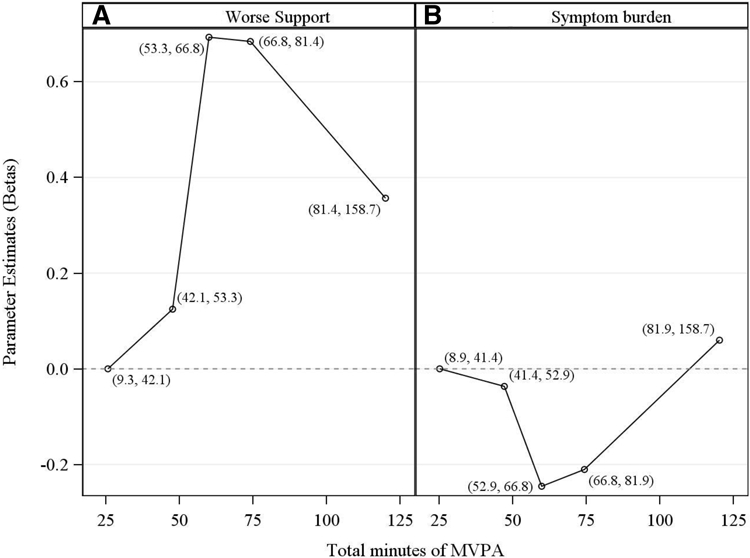
Fig. 3.

Figures demonstrate plots of relationships between each primary outcome and MVPA. On the y-axis is displayed the log of the prevalence ratio for each quintile versus the reference quintile (1st). The log of the prevalence ratio is the parameter estimate beta from an unadjusted modified Poisson regression. The x-axis displays total minutes of MVPA averaged over the two early postpartum time-points at which these data were collected. Open circles represent betas plotted at the mid-point of each quintile. The range for each quintile, in minutes, is shown next to each mid-point.
