
Extended Data Fig. 7: Control experiments pertaining to the INO80-mediated sliding of nucleosomes as reported in Fig. 2f.
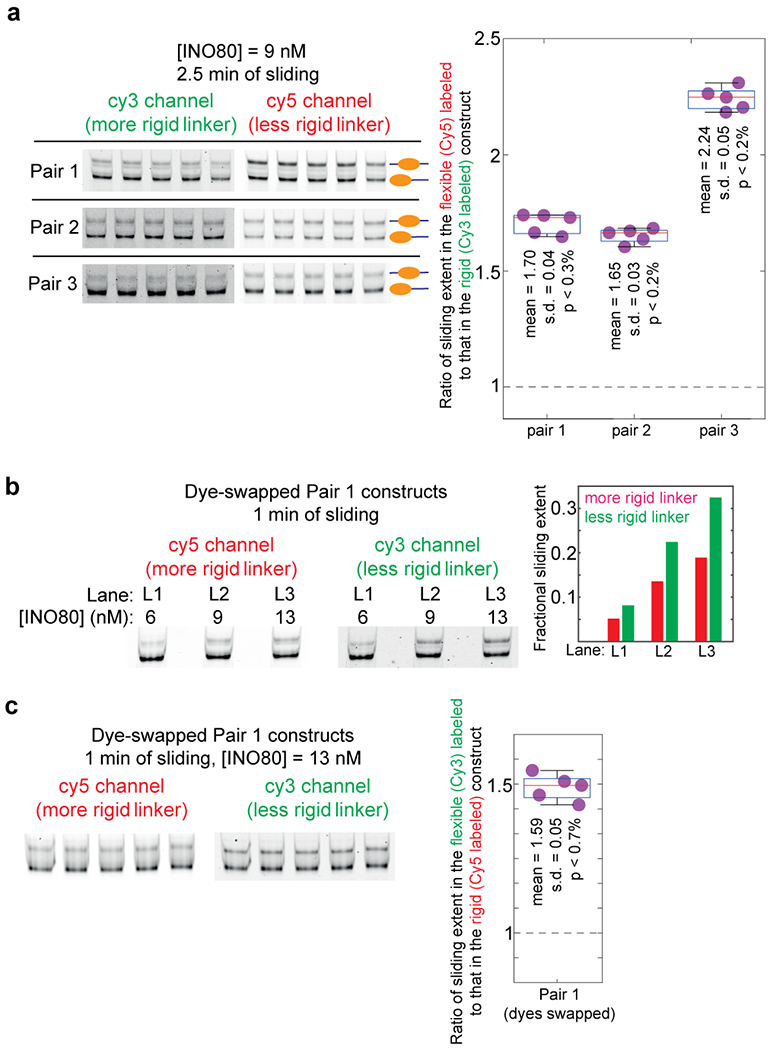
a, In order to assess our confidence in the result that INO80 mediated sliding is greater in the construct with the less rigid linker, we performed nucleosome sliding experiments similar to those reported in Fig. 2f five times for each pair in the presence of 9 nM INO80 and for 2.5 mins of sliding. These constitute technical replicates. The products of sliding were analyzed on a 6% TBE gel as done in Fig. 2f. Each gel was imaged separately for Cy3 and for Cy5 fluorescence and quantified to calculate the fold-difference in sliding extent between the flexible and the rigid construct in each pair. The measurements of fold-differences for each pair are displayed in the box plots, along with the actual data points. The central mark in each box (red) represents the median and the bottom and edges represent the 25th and 75th percentile respectively. The whiskers extent to the most extreme datapoints. Also indicated are the mean, standard deviation (s.d.), and the upper limit of the p value (defined here as the probability of obtaining a fold-difference of 1 if the distribution of fold differences has the same mean and s.d. as that of these 5 measurements) as obtained by the application of Chebyshev’s inequality. Dashed line represents a fold-difference of 1. b, In the experiment described in Fig. 2f, the more rigid construct in all pairs was labeled with Cy3, while the less rigid construct was labeled with Cy5. This control verifies that the result that sliding extent in greater in the less rigid construct is not influenced by different dye properties. We swapped the dyes between the two constructs in pair 1. We then performed nucleosome sliding experiments on this modified pair 1 constructs for the three INO80 concentrations that yielded detectible sliding in Fig. 2f (6, 9, 13 nM), and for 1 minute of sliding as done in Fig. 2f. The products of sliding were analyzed on a 6% TBE gel, and the sliding extents quantified as done in Fig. 2f. We indeed find that even when the dyes are swapped, sliding extent is greater for nucleosomes formed on the less rigid construct. c, To obtain better statistics of sliding along the dye-swapped pair 1 constructs, we repeated one of the conditions in panel b (13 nM INO80, 1 min of sliding) five times. These constitute technical replicates. The measured fold-difference values are displayed in the box plot. The central mark in each box (red) represents the median and the bottom and edges represent the 25th and 75th percentile respectively. The whiskers extent to the most extreme datapoints. Also indicated are the mean, standard deviation (s.d.), and the upper limit of the p value (defined as in panel a) as obtained by the application of Chebyshev’s inequality. Dashed line represents a fold-difference of 1.