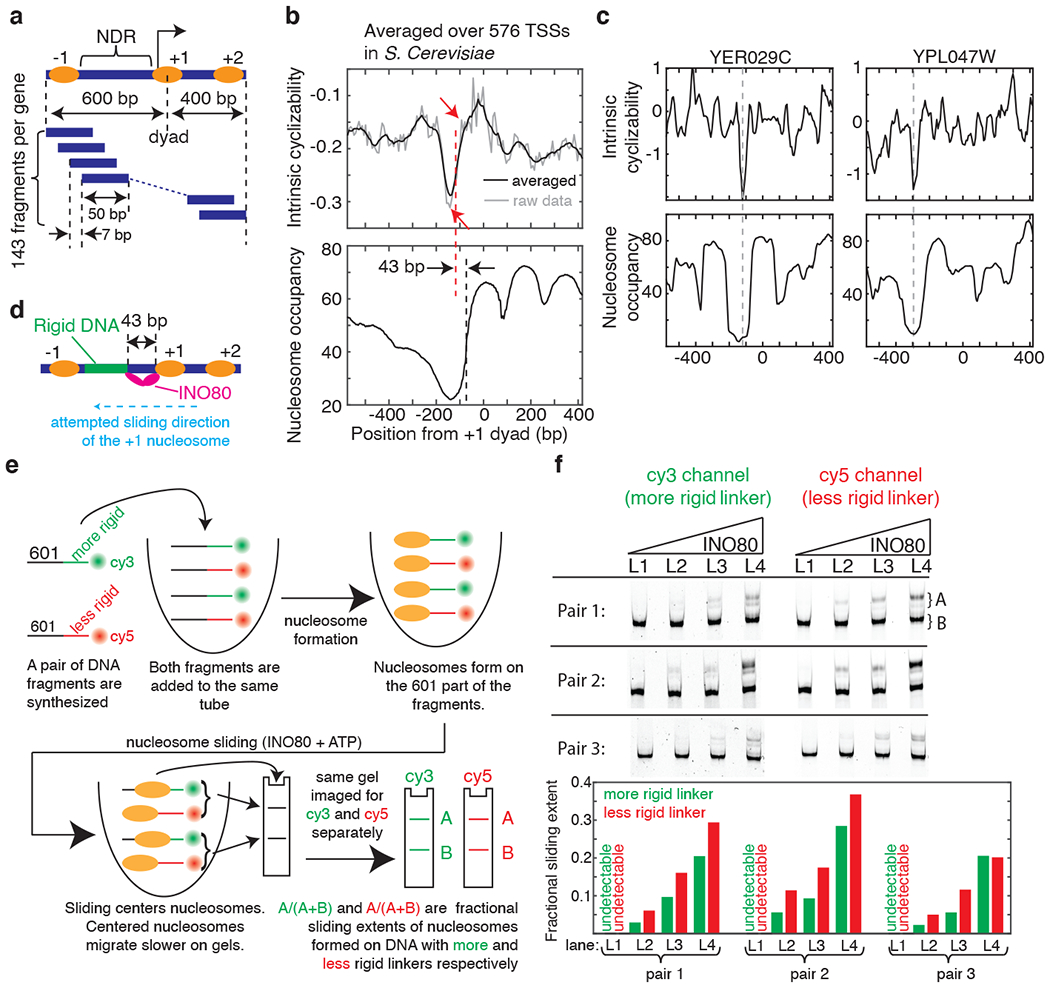
Figure 2: DNA mechanics contributes to nucleosome depletion at the NDR and modulates remodeler activities.

(a) Schematic of the Tiling Library. The regions around the TSSs of 576 genes were tiled at 7 bp resolution (Supplementary Note 9). DNA: blue bars, nucleosomes: ovals. (b) Mean intrinsic cyclizability (with (black) and without (grey) any smoothening) and nucleosome occupancy17 vs position from the canonical location32 of the dyad of the +1 nucleosome, averaged over all 576 genes in the Tiling Library. Blue dashed line (at −73 bp): edge of the +1 nucleosome, red dashed line: start of the rigid DNA region (approximated as the midpoint between the two red arrows). See supplementary note 10. (c) Intrinsic cyclizability and nucleosome occupancy vs position from the dyads of the +1 nucleosomes of two individual genes (see Extended Data Fig. 5 for more examples). (d) INO80 attempting to slide a +1 nucleosome upstream of its canonical location would be poised to contact the rigid DNA region via its Arp821,23. (e) Schematic of the experiment comparing the extent of nucleosome sliding by INO80 on a pair of constructs comprising a nucleosome attached to a rigid or flexible linker region, and distinguished by different fluorophores. Sliding results in centered nucleosomes, which migrate more slowly23. See Supplementary Note 11. (f) Three nucleosome sliding experiments were performed involving three pairs of nucleosome constructs as described in figure 2e and supplementary note 11. For each pair, four [INO80] were used (lanes L1 – L4): 2, 6, 9, and 13 nM. Post sliding, nucleosomes were run along a 6% TBE gel, which was imaged separately for Cy3 and Cy5 fluorescence. For each lane ([INO80]), the nucleosome sliding extents in the two constructs in the pair were quantified (bar plots). See figure 2e and supplementary note 11.
