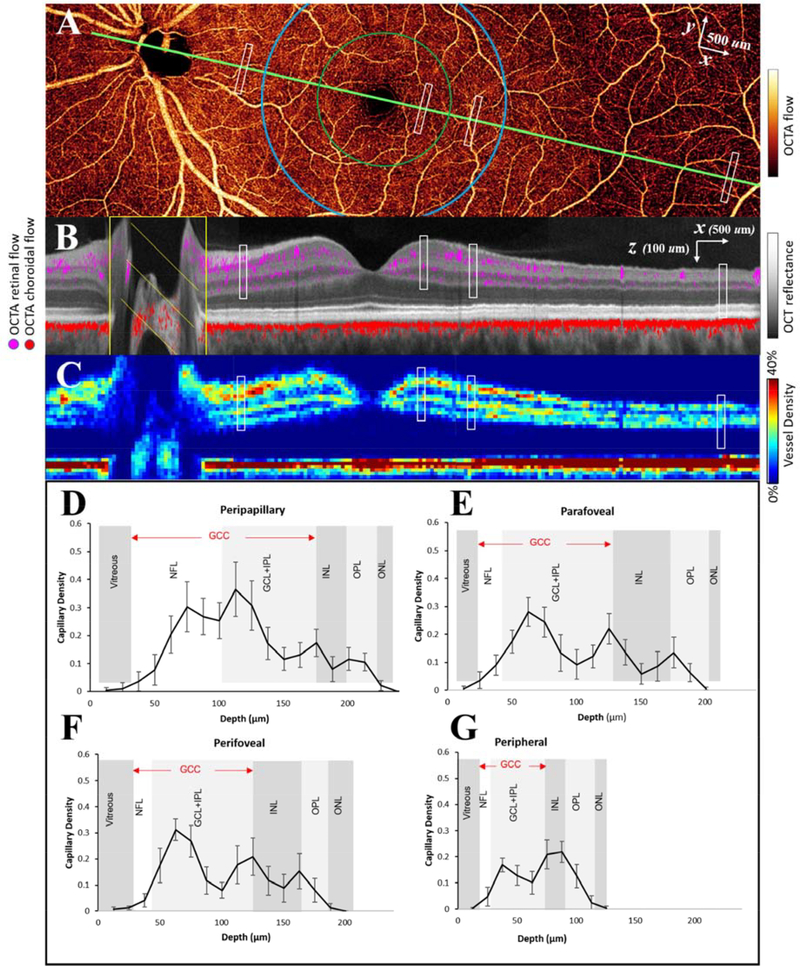
Figure 9.
Vascular anatomy of a healthy retina as imaged by OCTA. (A) Montaged high-definition en face OCTA of the inner retina. The green line shows the maculopapillary axis and the green and blue circles demarcate the parafovea and perifovea, respectively. (B) Cross-sectional view along the maculopapillary axis. Retinal (violet) and choroidal (red) flow signal are overlaid on the structural OCT image (reflectance in grayscale). (C) Cross-sectional image showing color-coded vascular density. (E-G) Capillary density by depth in 4 distinct regions, marked by the white rectangles in (A-C), support the existence of 4 distinct plexuses in some parts of the retina. NFL: nerve fiber layer; GCL: ganglion cell layer; IPL: inner plexiform layer; OPL: outer plexiform layer; ONL: outer nuclear layer. Adapted with permission from Campbell et al. (Campbell et al., 2017b).

