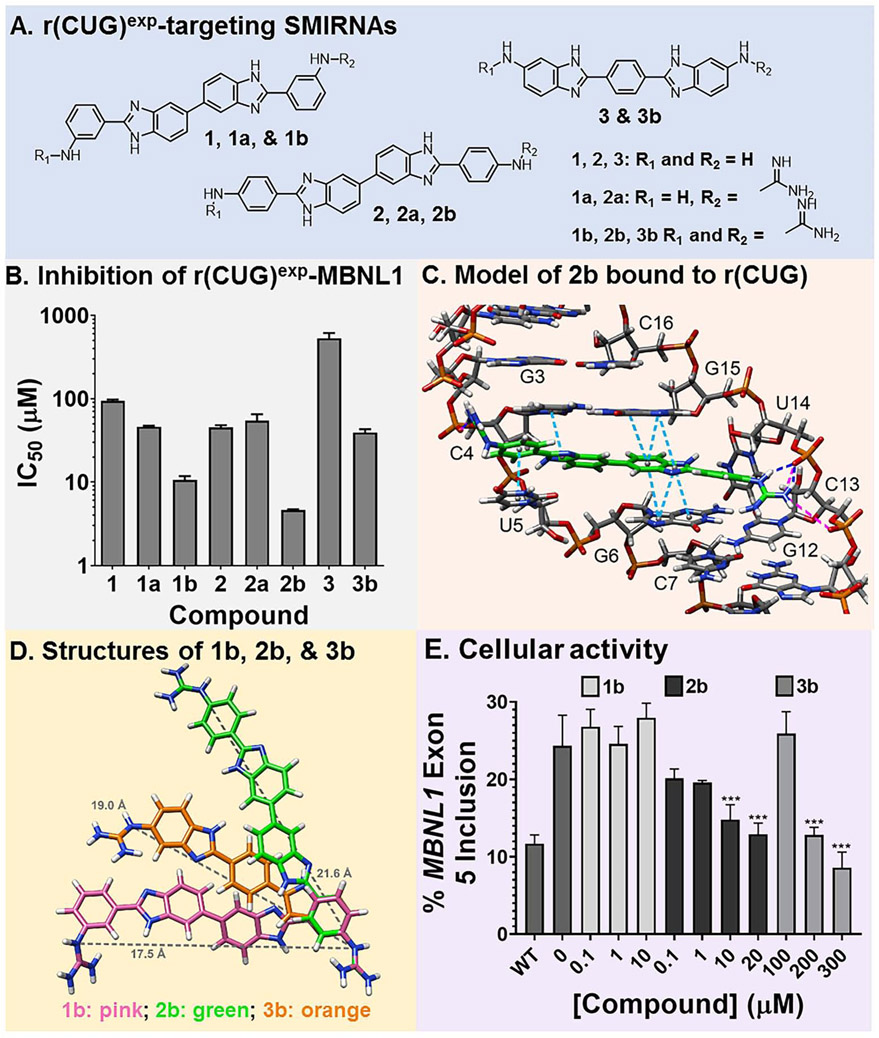
Fig. 2.
Design of compounds that bind r(CUG)exp. (A) Structures of small molecules interacting with RNA (SMIRNAs) that target r(CUG)exp. (B) Studying compounds in vitro by using a previously reported TR-FRET assay to identify compounds that inhibit the r(CUG)exp-MBNL1 complex. (C) 3D model of interactions of 2b with the loops formed by r(CUG)exp. Pink lines are ionic interactions, dark blue lines are hydrogen bonding interactions, and light blue lines are stacking interactions. (D) Structures of 1b (pink), 2b (green), and 3b (orange) used to calculate the distance between guanidine substituents (gray line). (E) Quantification of MBNL1 exon 5 inclusion DM1 fibroblasts by 1b, 2b, and 3b (n = 3). **, P < 0.01; ***, P < 0.001, as determined by a one-way ANOVA by comparison to untreated cells. Data are represented as mean ± SD. See also Figures S1 and S2.

