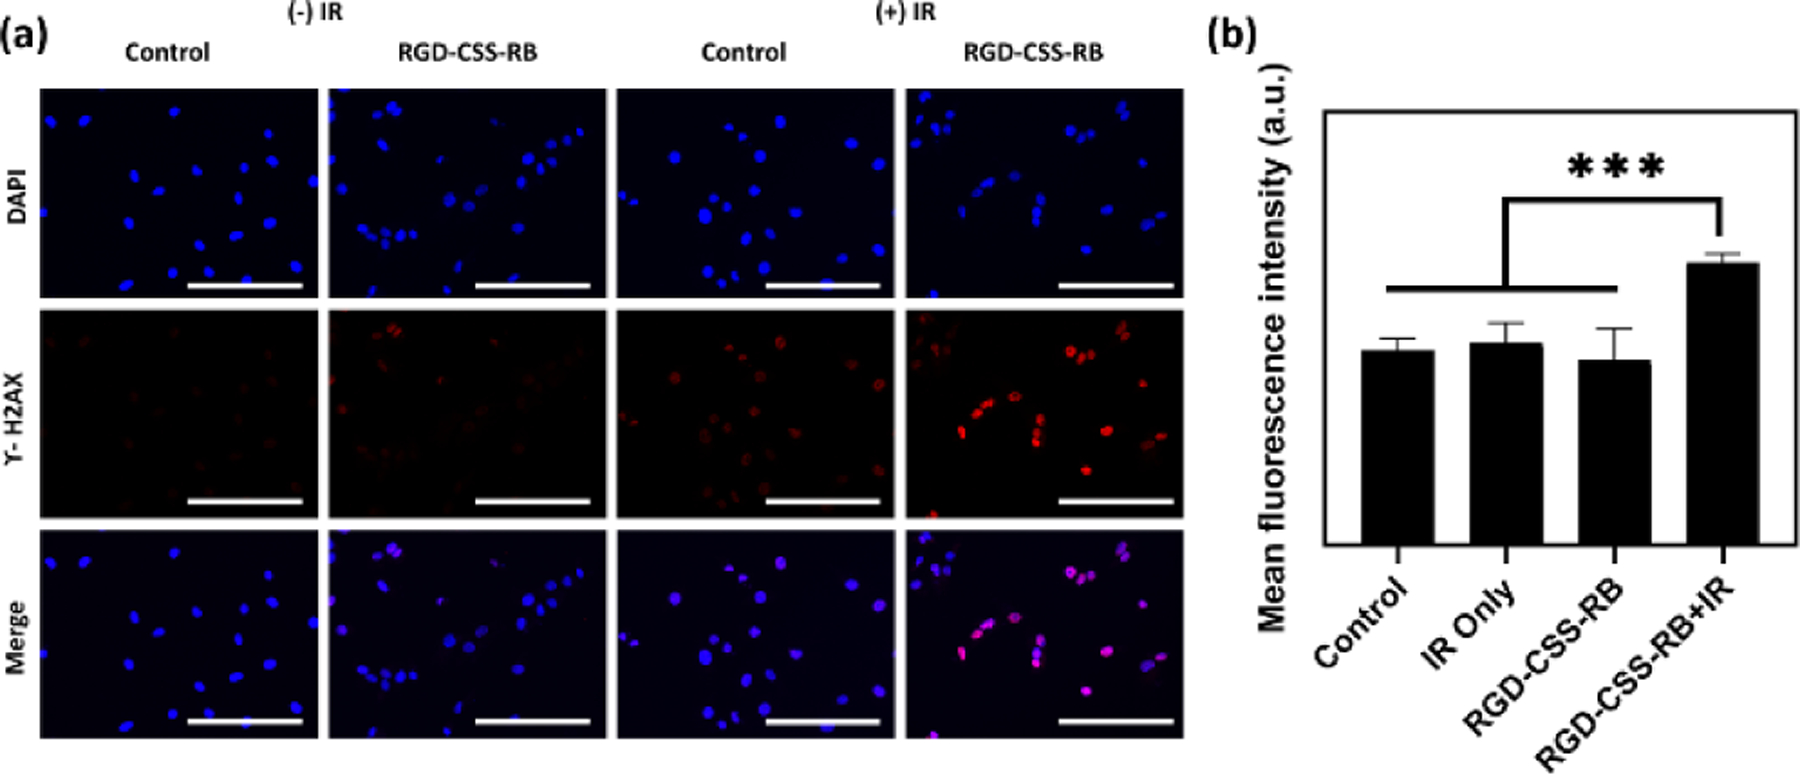
Figure 4.

(a) Representative immunofluorescence images with the γ-H2AX staining assay to highlight the DNA damage after different treatments. Scale bar represents 200 μm. (b) Mean fluorescence intensity results show the increased DNA damage resulted by the combination of RGG-CSS-RB and X-ray irradiation (4 Gy).
