
Extended Data Fig. 6 |. Global and local resolution of isolated RS1.
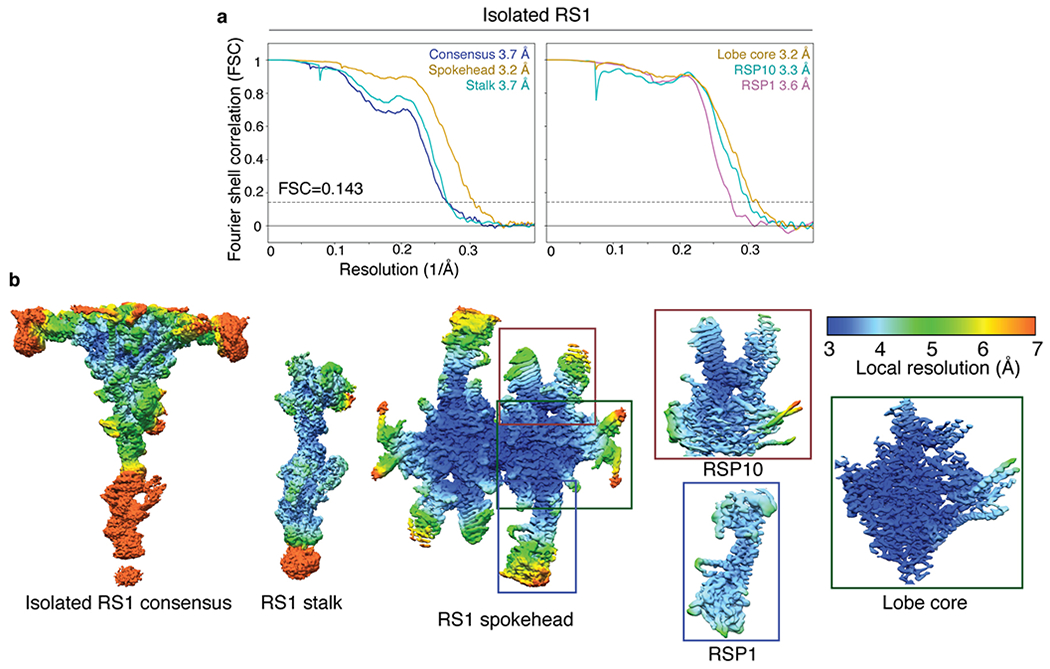
a, FSC curves calculated between masked independent half maps for isolated RS1. Left panel, FSC curves are shown for the consensus refinement of isolated RS1, focused refinement of the stalk, and focused refinement of the spokehead after applying C2 symmetry. Right panel, FSC curves for focused refinements of three subdomains of a single lobe of the RS1 spokehead. The colors of the curves match the masks used in Extended Data Fig. 5g. The nominal resolution was estimated using the FSC = 0.143 criterion (dashed line). b, Density maps for the consensus refinement of isolated RS1 and various focused refinements colored by local resolution. The local resolution is colored from 3 to 7 Å.