
Extended Data Fig. 3 |. Map quality.
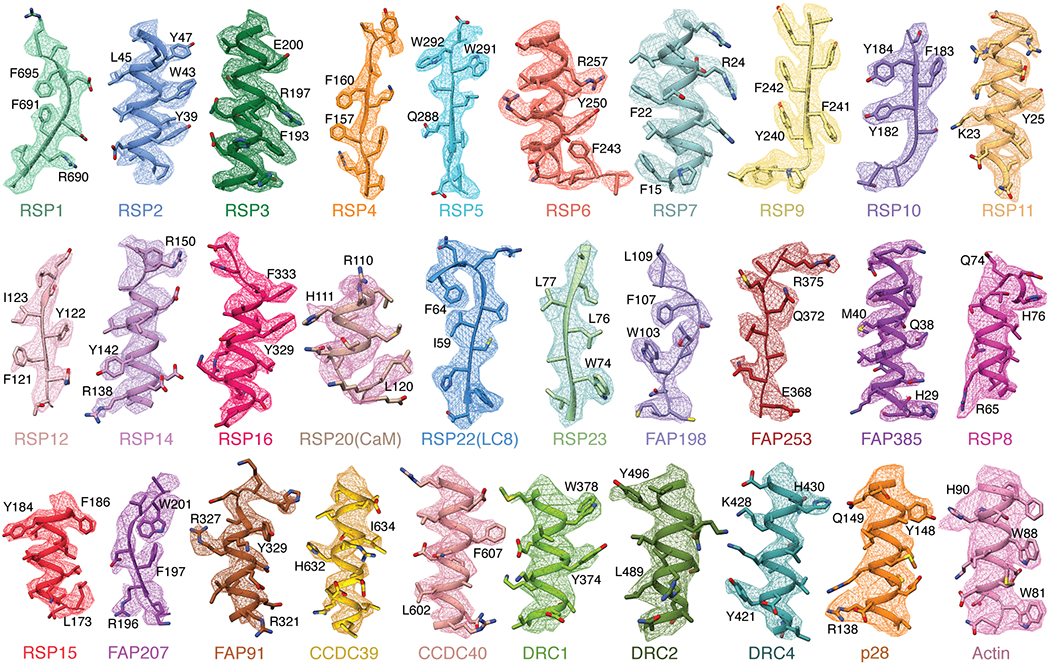
Examples of map density for all 30 non-tubulin proteins identified in this study. The first 19 proteins show density from isolated RS1 contoured at 0.009-0.013. The remaining 11 proteins (starting from RSP8) show density from on-doublet maps contoured at 0.020-0.031. Landmark residues are labeled. Note that the sidechains of RSP20 (calmodulin) and RSP8 are not well resolved and are truncated in the deposited model.