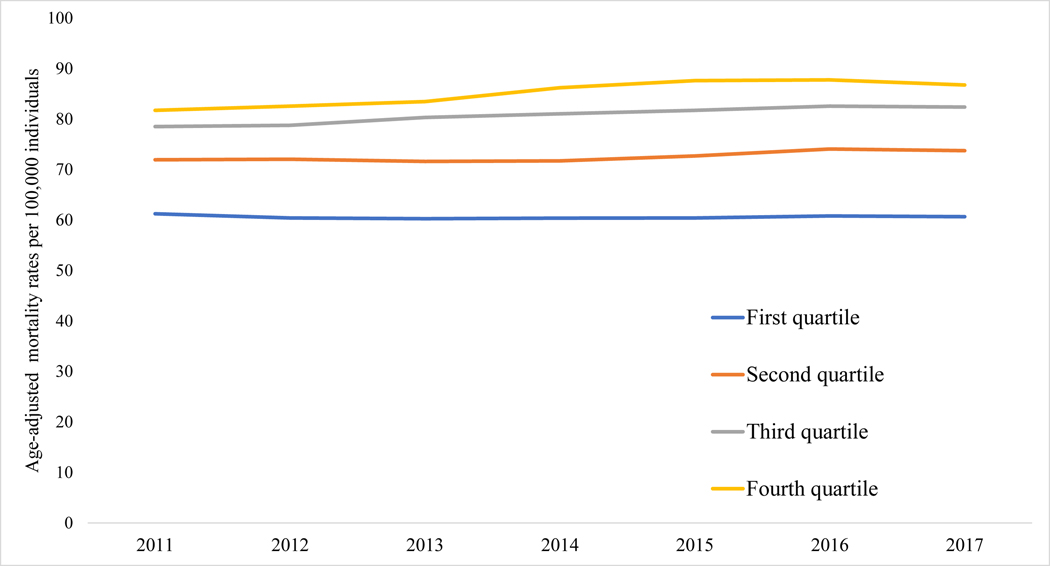
Figure 1: Annual age-adjusted cardiovascular mortality rates for 20 to 64 year old adults by quartile of mean annual percent change in county food insecurity rates between 2011 and 2017.
Estimated county-level food insecurity rates were obtained from the Map the Meal Gap project. Mean annual percent change in food insecurity is the mean of the annual percent change in food insecurity between each year over the study period.

