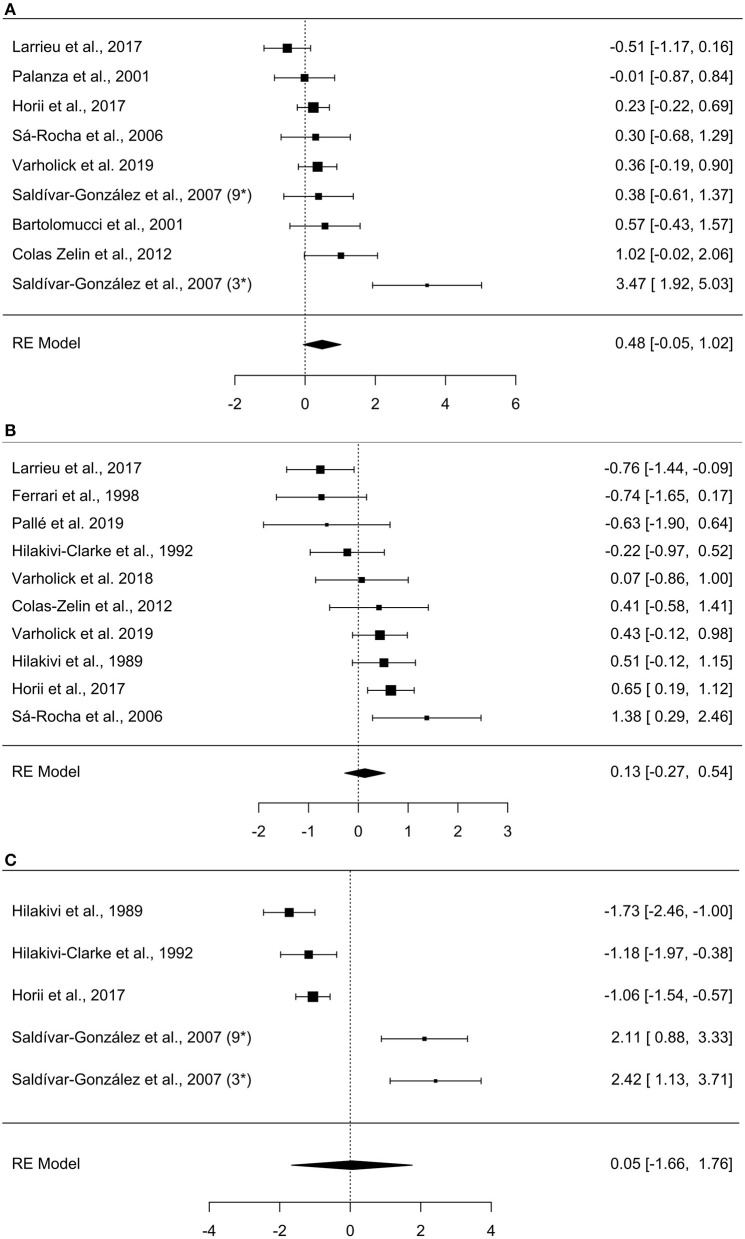
Figure 2.
Forest plots of meta-analyses. (A) Open field, (B) Elevated plus-maze, (C) Porsolt forced swim test. Observed effect sizes and 95% confidence intervals are provided in the right column. Negative effect sizes represent increased values for subordinate mice (e.g., increased exploration in the open field), while positive effects represent increased values for dominants. The overall effect size is denoted by the diamond symbol. The study by Saldívar-González et al. (2007) is marked with 3* and 9* to denote the effects of the separate group-sizes of 3 and 9.

