
Figure 2.
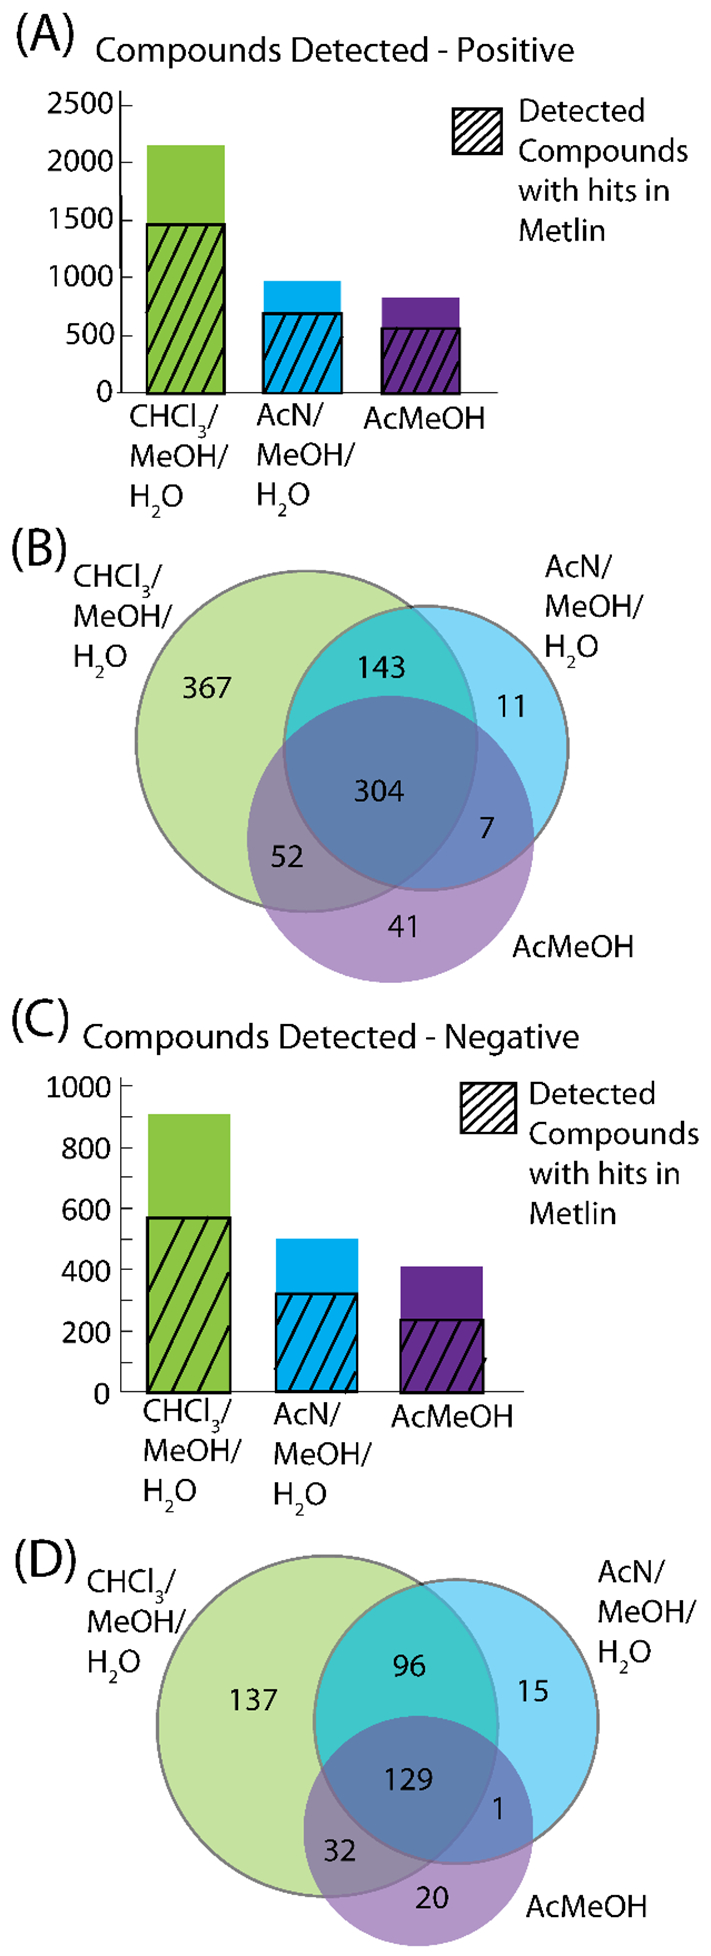
Metabolomics results for the three extractions. The number of compounds detected is shown for positive (A) and negative (C) mode. The m/z with hits in METLIN were compared between the three extractions in Venn Diagrams (B), positive and (D), negative mode.