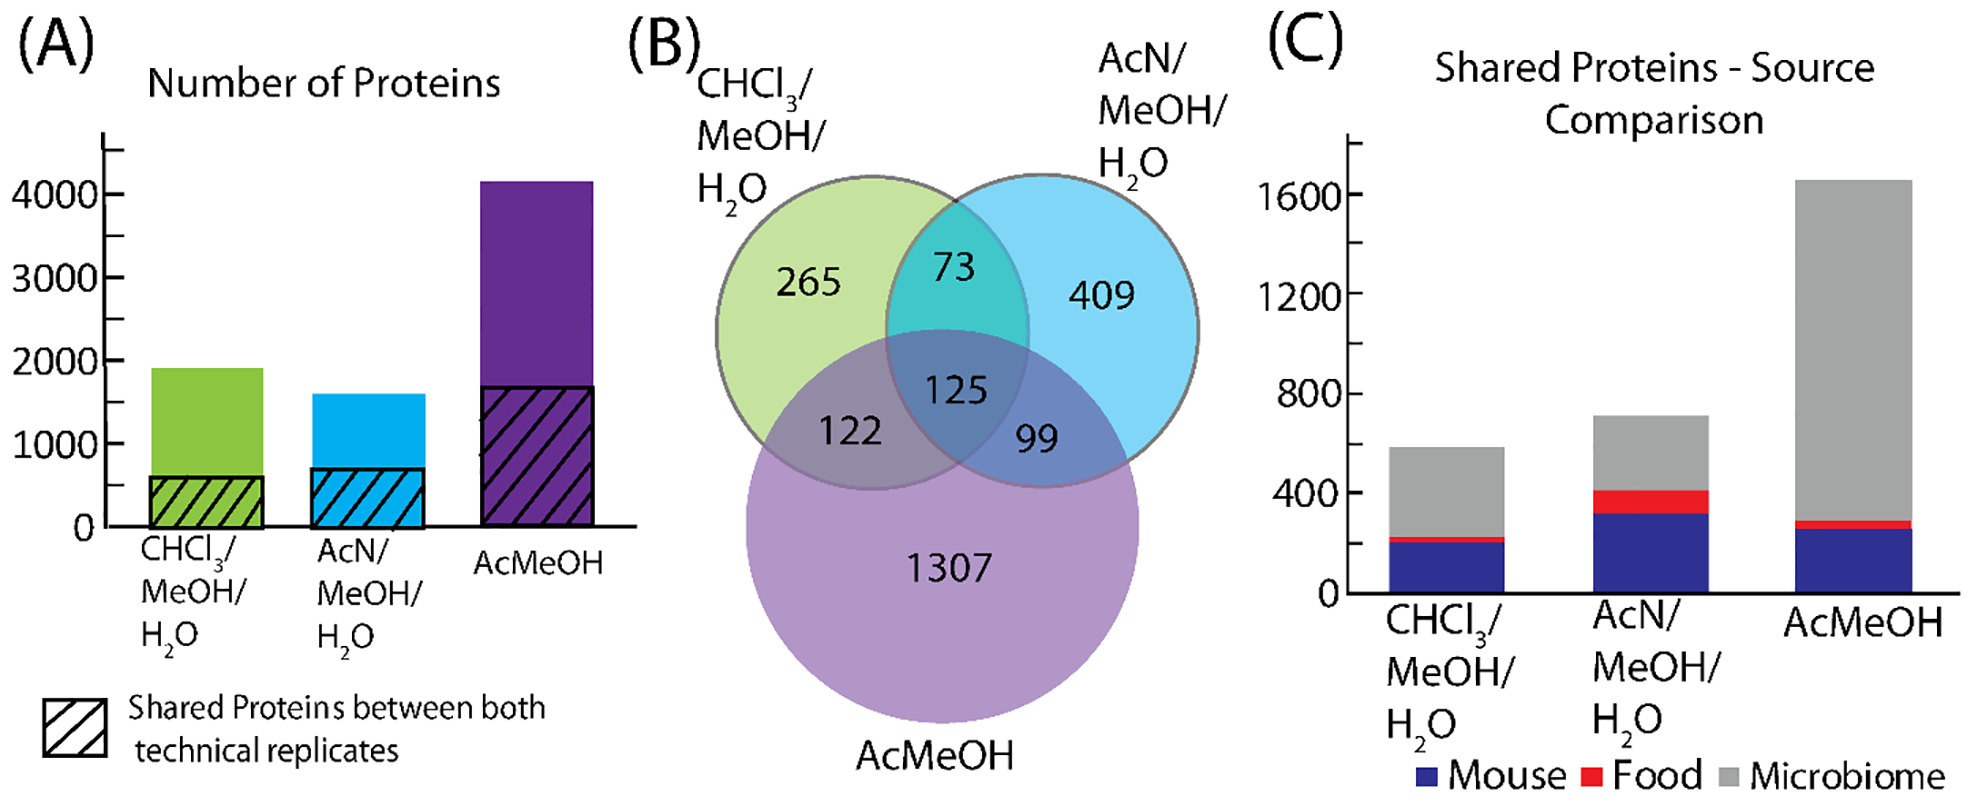
Figure 5.

Proteomics results from extraction optimization. (A) shows the detected proteins with the diagonal lines representing the number of shared proteins in both technical replicates. (B) compares the shared proteins in both technical replicates for the three extractions. (C) shows the breakdown of the shared proteins to the source of the protein ID for each extraction.
