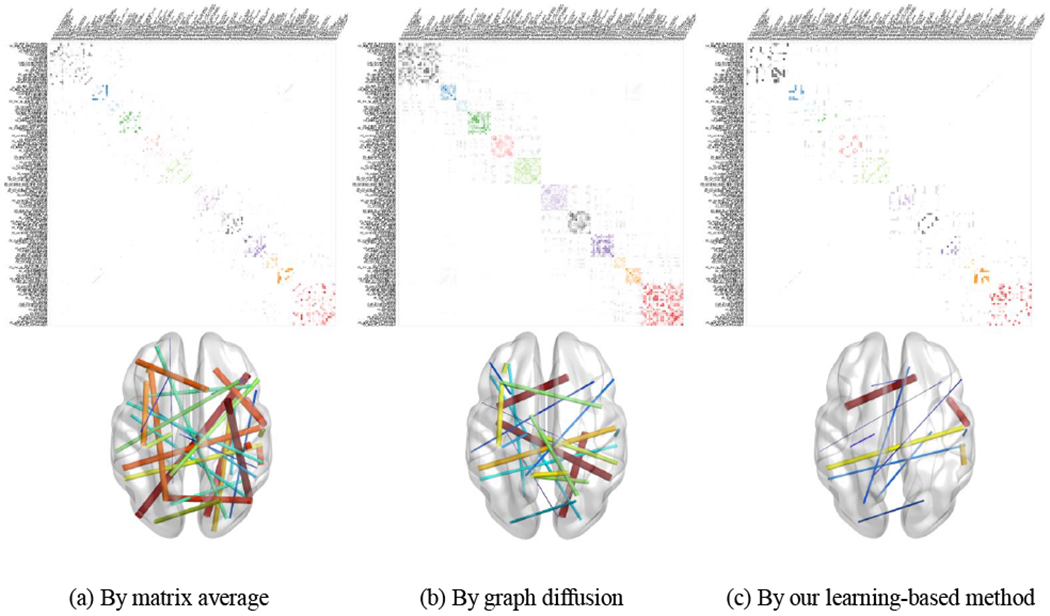
Fig. 11.

Top: The structural connectome atlas constructed by matrix averaging (a), graph diffusion (b), and our learning-based method (c). Bottom: The replicability results after resampling tests where the link designates the statistically significant difference, and the link thickness reflects the variation of connectome strength across resampling tests.
