
Fig. 8.
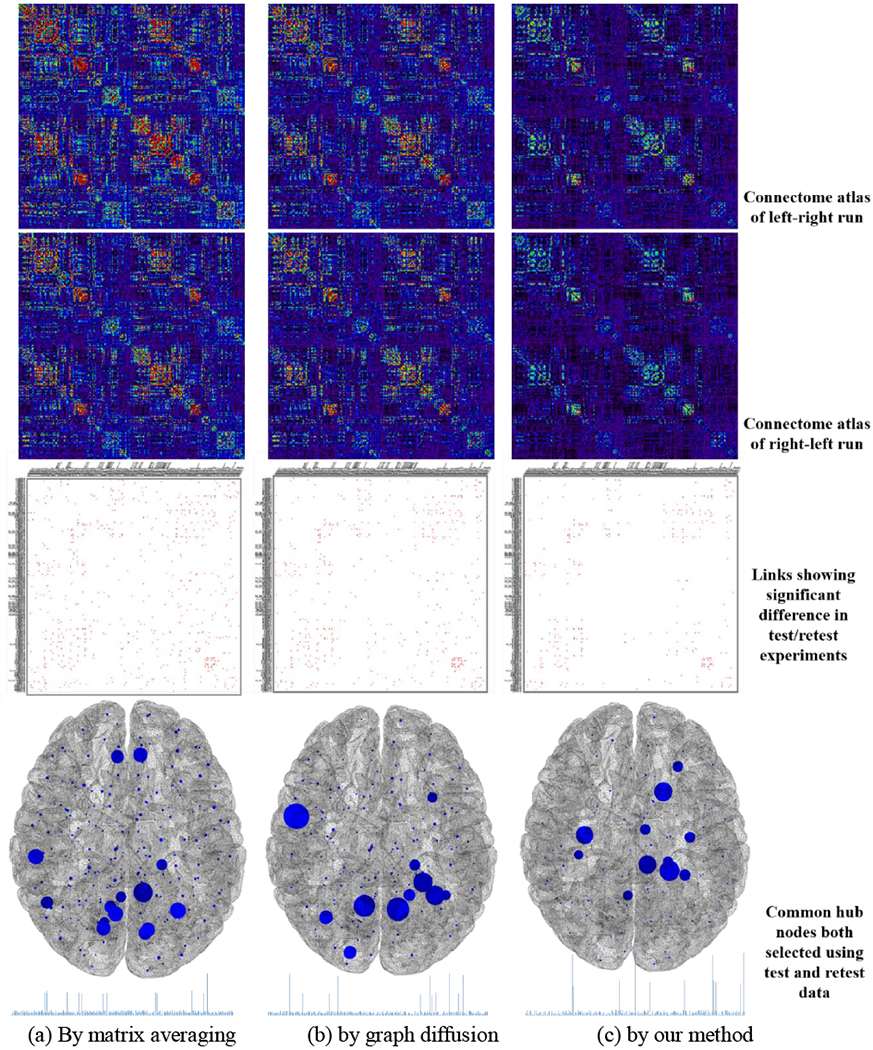
The replicability test on HCP dataset by matrix averaging (a), graph diffusion (b), and our graph learning-based method (c). The first and second row show the connectome atlas constructed using all left-right run and right-left run rs-fMRI data, respectively. The third row show the links (red dots) showing significant differences in 1,000 test/retest experiments. The last row shows the common hub nodes that are selected in each test/retest experiment, where larger node size reflect higher frequency of being both selected.