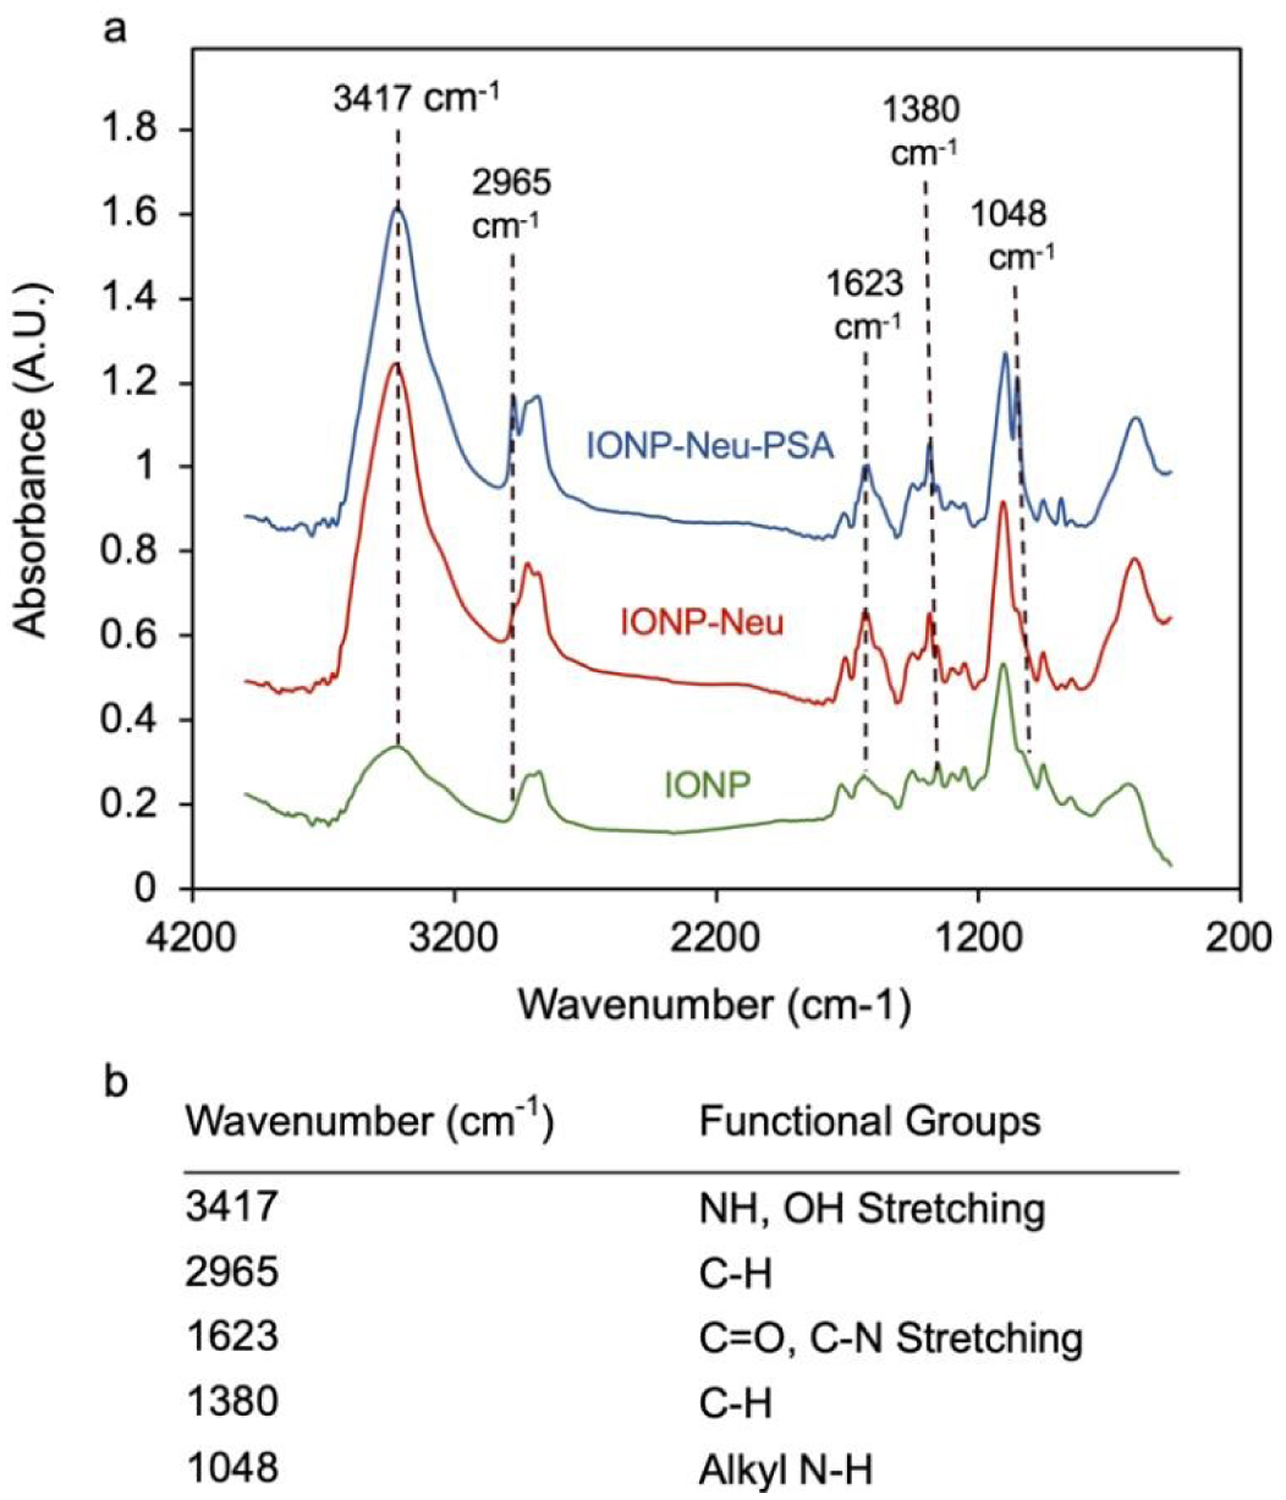
Fig. 2.

NP bound PSA characterization and quantification. (a) FTIR absorbance spectrum analysis of IONP-Neu-PSA and IONP-Neu with IONP as the control particle. Peak wavenumbers unique to IONP-Neu and IONP-Neu-PSA are delineated with dashed lines. (b) Summary table of the wavenumbers of interest with their corresponding functional groups.
