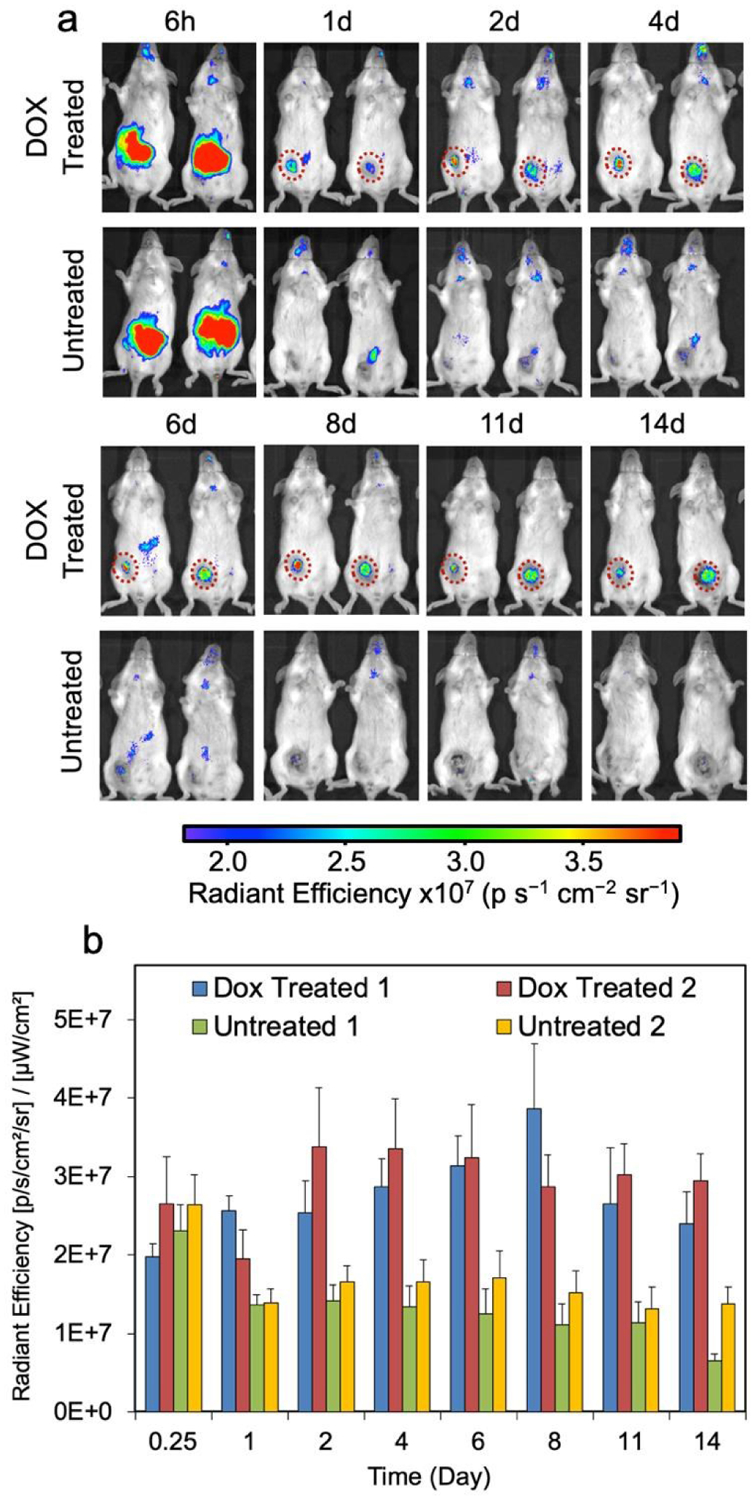
Fig. 8.

In vivo monitoring of apoptosis. (a) Representative Near-IR images of two groups of tumor-bearing mice, with one group treated with DOX and another group receiving no treatment. Mice were monitored with IVIS for 14 days starting 6 hours post IONP-Neu-PSA-Cy5.5 injection. IONP-Neu-PSACy5.5 labeled apoptotic tumor regions are highlighted with a red dashed circle. The left and right mouse of the untreated group in each image are designated as Untreated 1 and Untreated 2, respectively. (b) Quantitation of the near-IR fluorescent intensity in (a). The left mouse and the right mouse in the Dox treated panel are assigned as Dox Treated 1 and Dox Treated 2 respectively.
