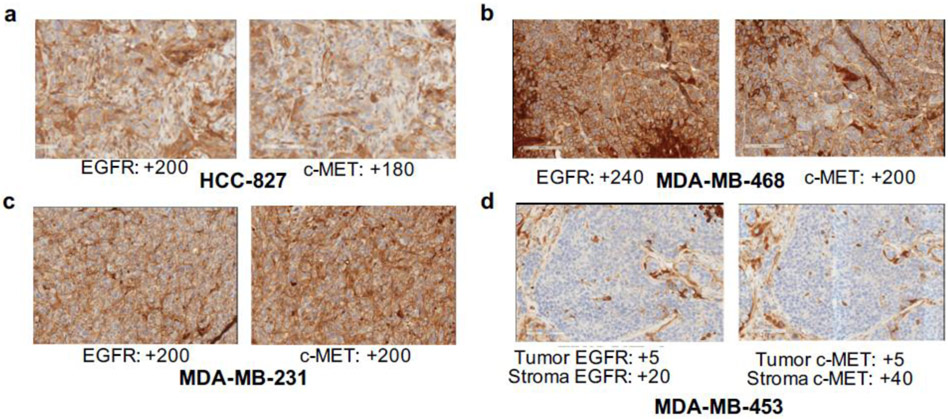
Fig. 12.
Ex vivo validation of EGFR and c-MET expression in HCC827 (a), MDA-MB-468 (b), MDA-MB-231 (c) and MDA-MB-453 (d) tumor sections via IHC. Brown stain represents receptor expression and blue counterstain represents nuclear staining (hematoxylin). Values represent H-scores, which were analyzed by board-certified pathologists

