
Extended Data Figure 4. MAFBmTagBFP2 reporter expression in organoids correlates to total nephron number.
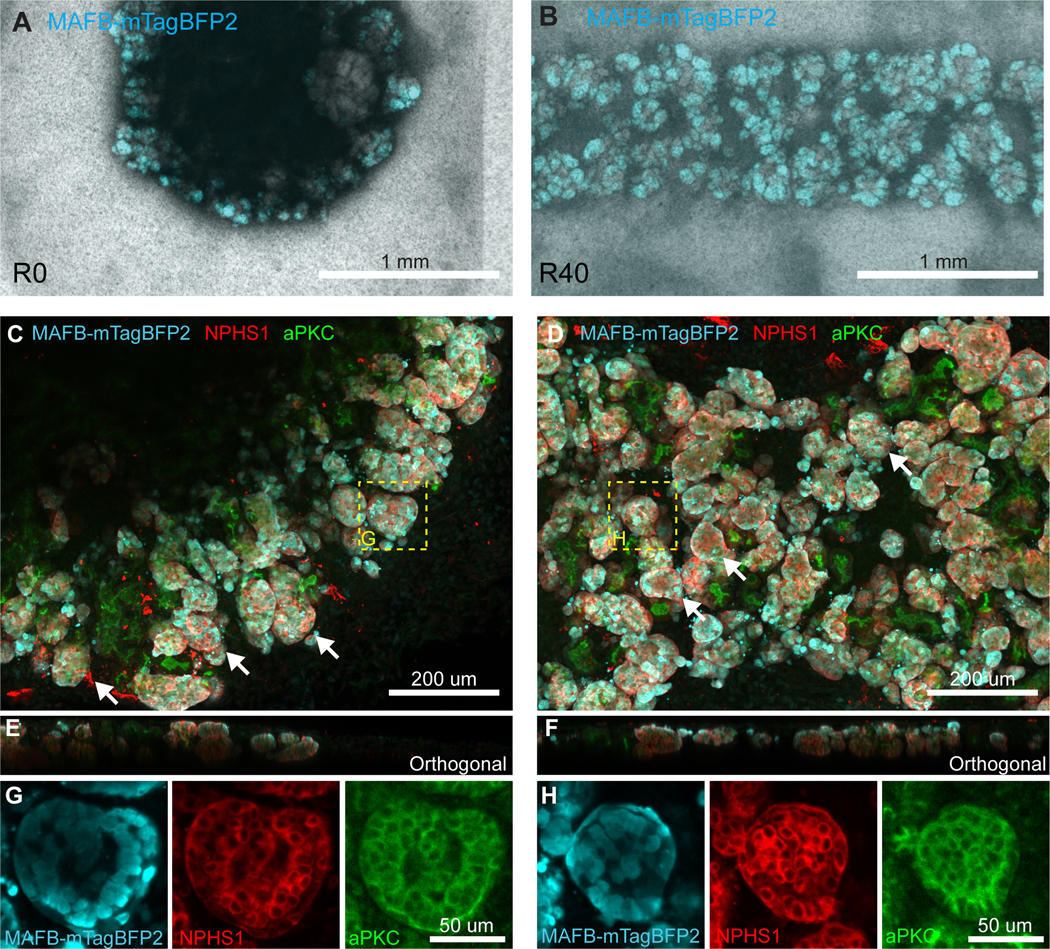
A,B. Examples of low resolution, high throughput imaging used to quantify MAFB+ area as a proxy for nephron volume in organoids. Brightfield and MAFBmTagBFP2 signal was captured for each organoid using a low NA 4x objective with a spinning disk system, enabling fast capture of many samples. With a large axial depth of field, these images capture the majority of signal within each organoid in a single plane. Given the similarity in thickness (E,F, Figure 3) this planar area is approximately proportional to total MAFB+ glomerular volume and hence correlates to nephron number. A portion of an example image used for quantification of R0 (A) and R40 (B) organoids at D7+12 is shown. Note R40 organoids are much longer and were captured by stitching multiple image fields. Only a small portion of the organoid is shown. C, D. Samples were fixed and stained at D7+12 for MAFBmTagBFP2 reporter (Cyan), mature podocyte marker NPHS1 (Red) and atypical protein kinase C (aPKC, Green), a marker of the apical cell membrane. Each nephron consists of a rounded glomerular structure containing podocytes (examples highlighted by white arrows) connected to other tubular segments that are marked by aPKC but lack NPHS1. Nephrons are seen throughout the field and are packed together so that individual nephrons cannot be easily separated visually. MAFBmTagBFP2 reporter is expressed specifically in NPHS1 expressing podocytes, but is absent from other nephron segments (aPKC+, NPHS1− regions) or from other cell types. Images are maximum projections (50 μm span). E,F. Both conditions have a similar axial morphology in nephron-containing regions when viewed as an orthogonal slice (ie along the imaging Z-axis). A single orthogonal slice rendered from a 3D stack is shown. G,H. Cropped high-resolution fields showing a single glomerulus for each condition confirm co-expression of MAFBmtagBFP2 reporter and NPHS1 in podocytes. A single confocal slice is shown. All images are representative of at least n = 3 stained samples.