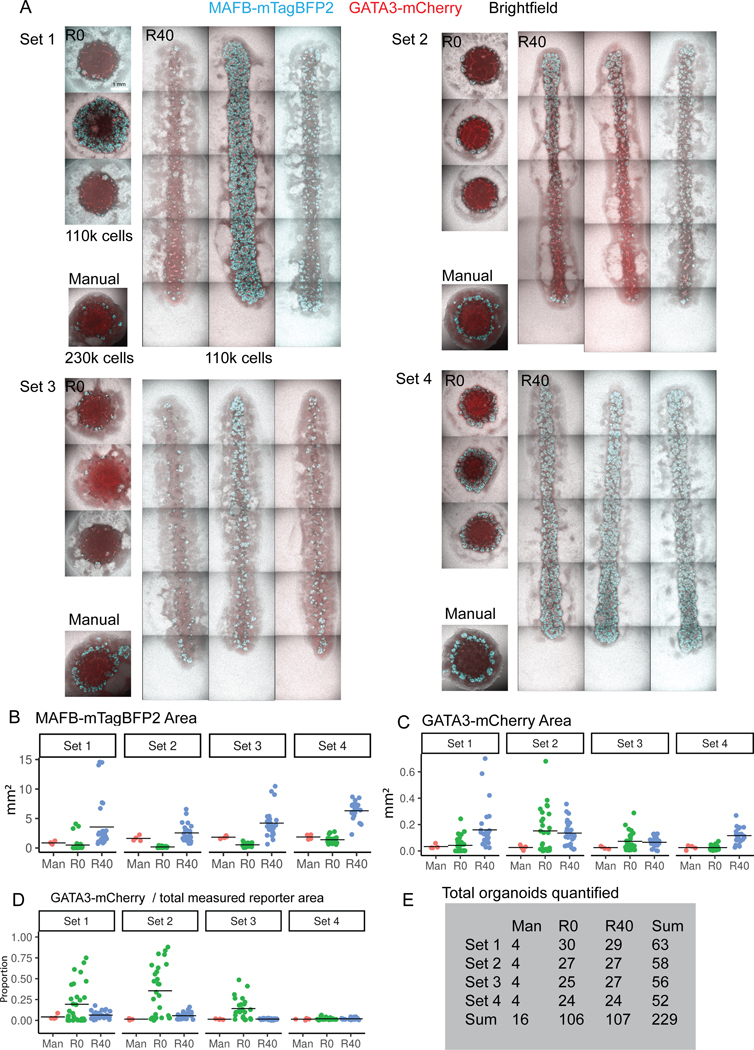
Extended Data Figure 5. Quantification of large image data sets associated with organoids used for single cell RNA seq.

Line organoids are approximately 12 mm long. A. Representative images from 3 separate wells across replicates and conditions. B. Quantification of MAFB-mTagBFP2 reporter area by set and condition. Data is as in Figure 5B, but here is separated by set. C. Quantification of GATA3-mCherry reporter area. Note that Y-axis scale differs between B and C, as GATA3 area represents a substantially smaller proportion of the organoid in most cases. D. GATA3 area as a proportion of total measured reporter area (MAFB + GATA3), highlighting a shift in R0 toward a more distalised fate. E. The total number of individual organoids used for quantification, by set and condition.
