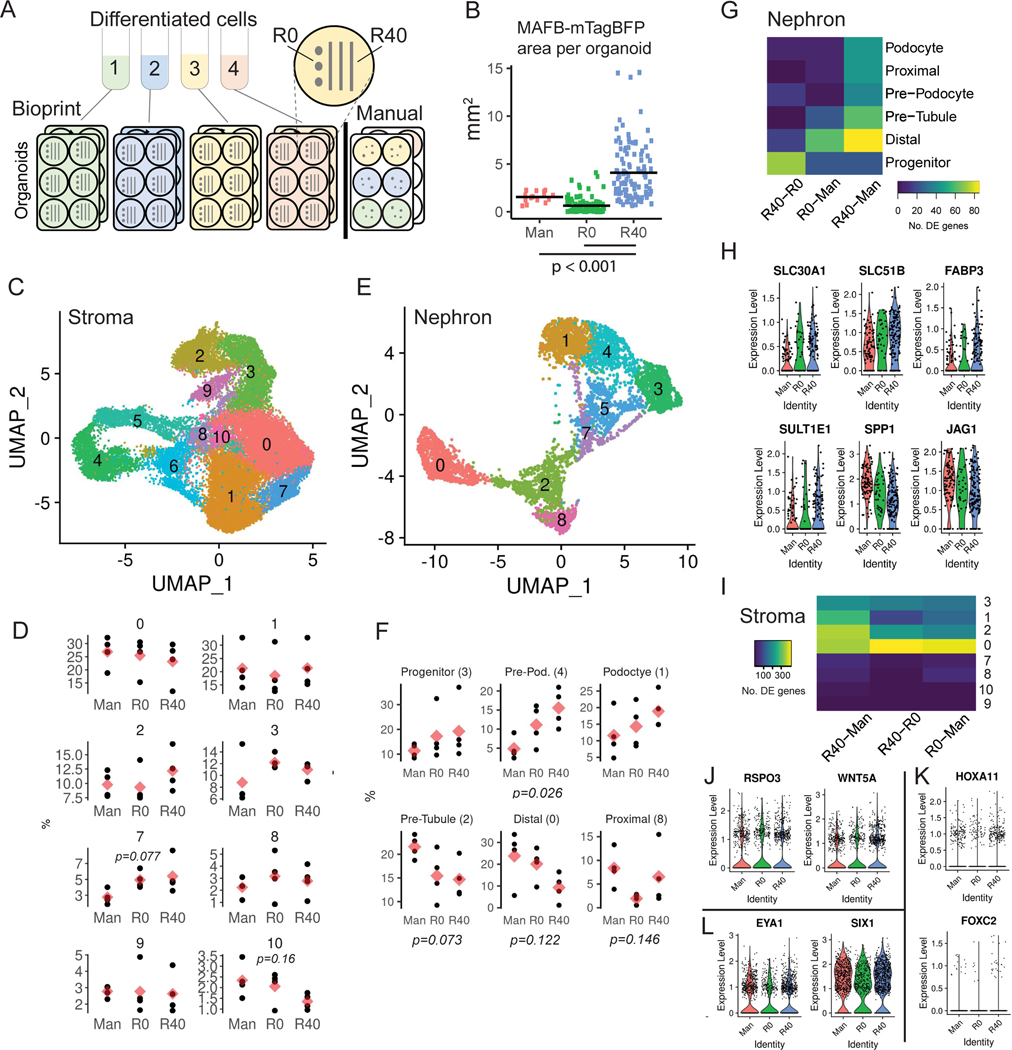
Figure 5. Single cell RNAseq comparison of manual organoids, bioprinted R0 ‘dots’ and bioprinted R40 ‘lines’.
A. A single scRNAseq library per condition was generated from multiple barcoded organoids sets. R40 and R0 were generated from 1.1 × 10⁵ cells, manual organoids from 2.3 × 10⁵ cells. B. MAFB reporter area is increased, indicating greater nephron number in R40 organoids. Bars indicate mean. R40-Man, p = 2.1 × 10⁻⁵, R40-R0, p = 2 × 10⁻¹⁶ (two-sided t-tests with the Holm correction for multiple comparisons). See Extended Data Figure 5. C. UMAP of stromal lineage scRNAseq data. See Extended Data Figure 6F and Supplementary Table 5. D. Cluster proportions by replicate and condition. P-value is stated where p < 0.2 (one-way ANOVA). Red diamonds represent mean for n = 4. E. UMAP of nephron lineage scRNAseq data. See Extended Data Figure 6D and Supplementary Table 4. F. Cluster proportion per condition. P-values as for D. For cluster 4, p = 0.021 for R40 vs Man (Tukey multiple comparison test, following ANOVA). G. Total number of filtered differentially expressed (DE) genes per pseudo-bulk comparison for nephron clusters. (Adjusted p-value < 0.05, Benjamini-Hochberg correction, see Supplementary Methods). Full gene lists and p-values are in Supplementary Data 1. H. R40 proximal tubule cells show significantly increased expression of genes associated with proximal tubule maturity (SLC30A1, SLC51B, FABP3, SULT1E1) and decreased expression of genes associated with early immature tubule (SPP1, JAG1) compared to manual organoids. Violin plots show the distribution of normalised single cell expression values, with individual cell values overlayed. I. Total number of filtered DE genes per pseudo-bulk comparison for stromal clusters (Supplementary Data 1). J. RSPO3 and WNT5A are significantly increased in R40 vs manual stromal cluster 2 cells. K, L. Genes associated with nephron progenitor identity are significantly increased in K. R40 vs Manual (HOXA11, FOXC2) and L. R40 vs R0 (EYA1, SIX1) stromal cluster 3 cells.

