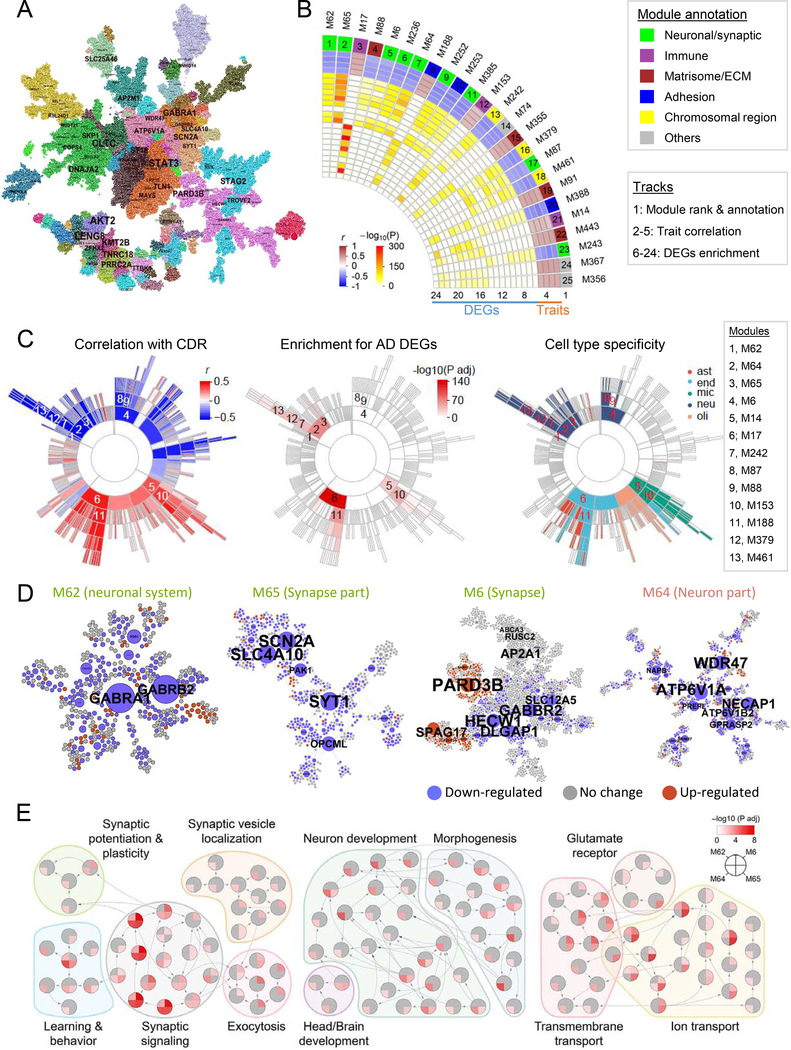
Fig. 2. Gene coexpression network analysis prioritizes neuronal modules associated with LOAD.
A, The MEGENA network in BM36-PHG. Node color denotes module membership. Font size of gene name is proportional to degree of connectivity. B, The 25 top-ranked modules. The heatmap shows the module ranking (number) and functional annotation (color) in track 1, the correlations (r) with the traits including bbscore, CDR, CERAD, and PlaqueMean in tracks 2–5, and adjusted P values of enrichment for down-(tracks 6–14) and up-regulated (tracks 15–24) DEGs. C, Sunburst plots showing the module hierarchy and correlation with CDR, enrichment for CDR demented-vs-nondemented DEGs, and enrichment for cell type markers. Numbers 1–13 denote 13 top-ranked modules as listed to the right. ast stands for astrocytes, end for endothelial, mic for microglia, neu for neurons and oli for oligodendrocytes. D, Networks of the top ranked neuronal modules M62, M65, M6, and M64. Node color denotes expression change in demented brains. Node size is proportional to node connectivity. E, Top-ranked neuronal modules enriched for GO biological process (BP) hierarchy in relation to synaptic function, neuronal development, and transportation. Each node denotes a GO/BP term, with a pie-chart displaying the significance of enrichment for the 4 neuronal modules in D. See also Fig. S6 & Table S5–7.

