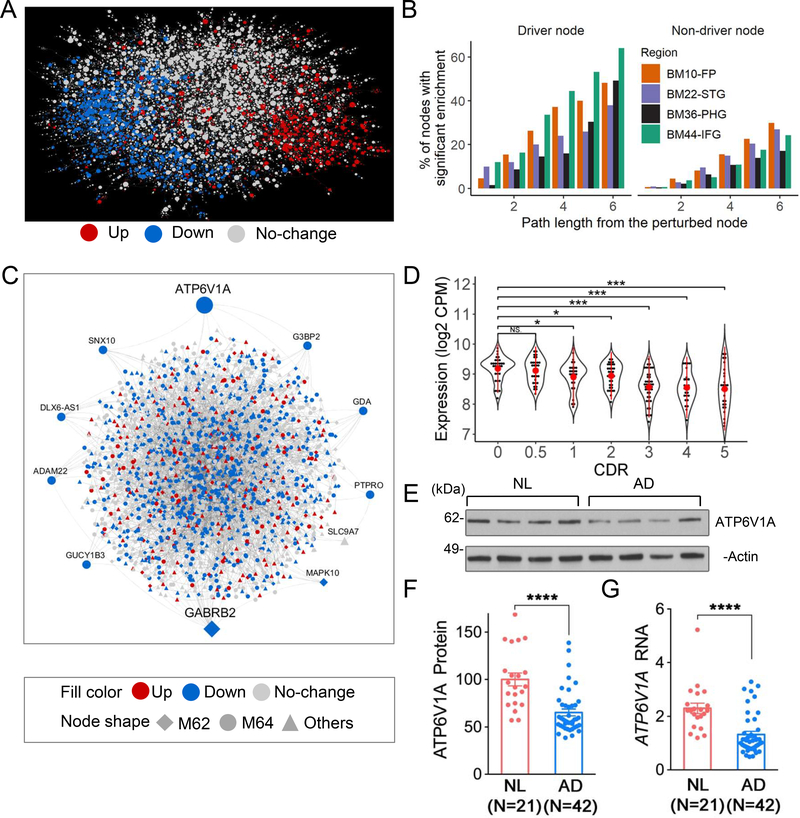
Fig. 3. Bayesian probabilistic causal network (BN) analysis predicts novel key drivers of LOAD.
A, BN in the BM36-PHG. B, Validation of the BN structure. The left panel shows the percentage of the global BN key drivers whose network neighborhoods are enriched for the perturbation signature. The right panel shows the same analysis for the non-driver nodes. C, Projection of the modules M62 and M64 onto the BM36-PHG BN. Node labels are shown for the module key drivers. D-G, A novel network key driver ATP6V1A is down-regulated in LOAD. D, ATP6V1A expression in the RNA-seq data of the BM36-PHG region as stratified by CDR. E-G, Validation of ATP6V1A expression change in MSBB BM36-PHG samples using western blot (WB) (E-F) and qRT-PCR (G) analyses. E, Representative WB of ATP6V1A level. (t-test or ANOVA with Dunnett’s test. Error bars represent SE. *p < 0.05. **p < 0.01. ***p < 0.001. ****p < 0.0001. NS, no significance.). NL, normal control. See also Fig. S12–14 & Table S14–15.

