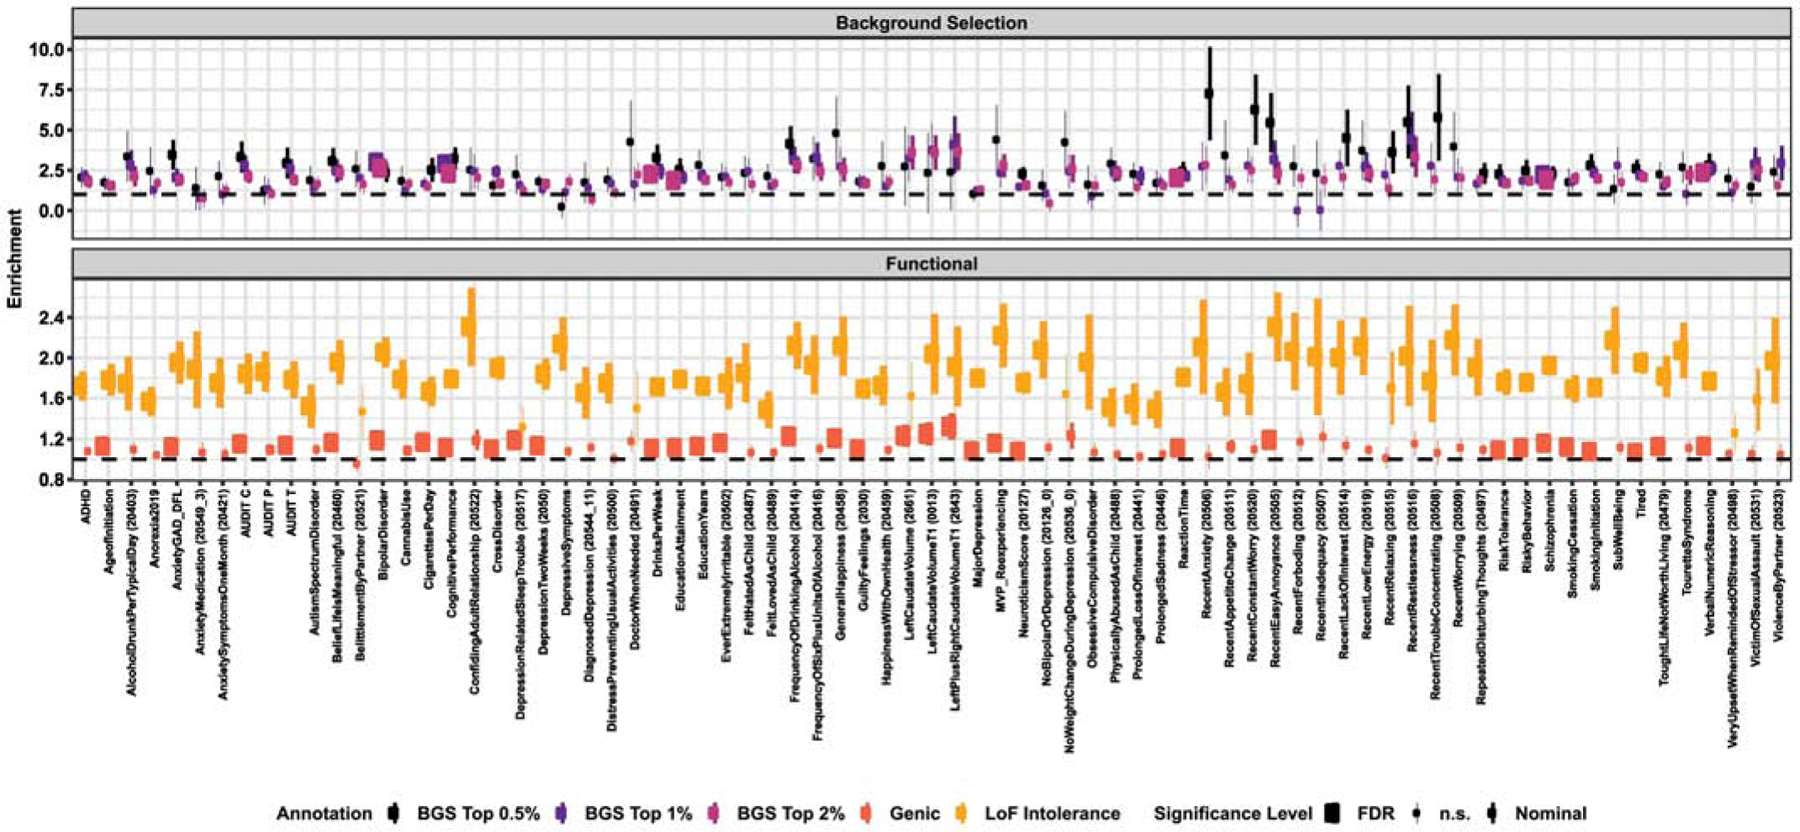
Figure 1. Enrichment of natural selection and functional annotation measures.

Significant enrichments of genic and loss-of-function (LoF) intolerant loci (A) and three genomic annotations of background selection (BGS). Both panels list phenotypes in descending order from highest to lowest magnitude enrichment for the most abundant annotation (i.e., LoF intolerance in panel A and top 2% of BGS scores in panel B). All phenotypes listed were at least nominally significant (p<0.05) and solid circles indicate that the enrichment survived multiple testing correction (q<0.05). Error bars represent the 95% confidence interval around each enrichment estimate.
