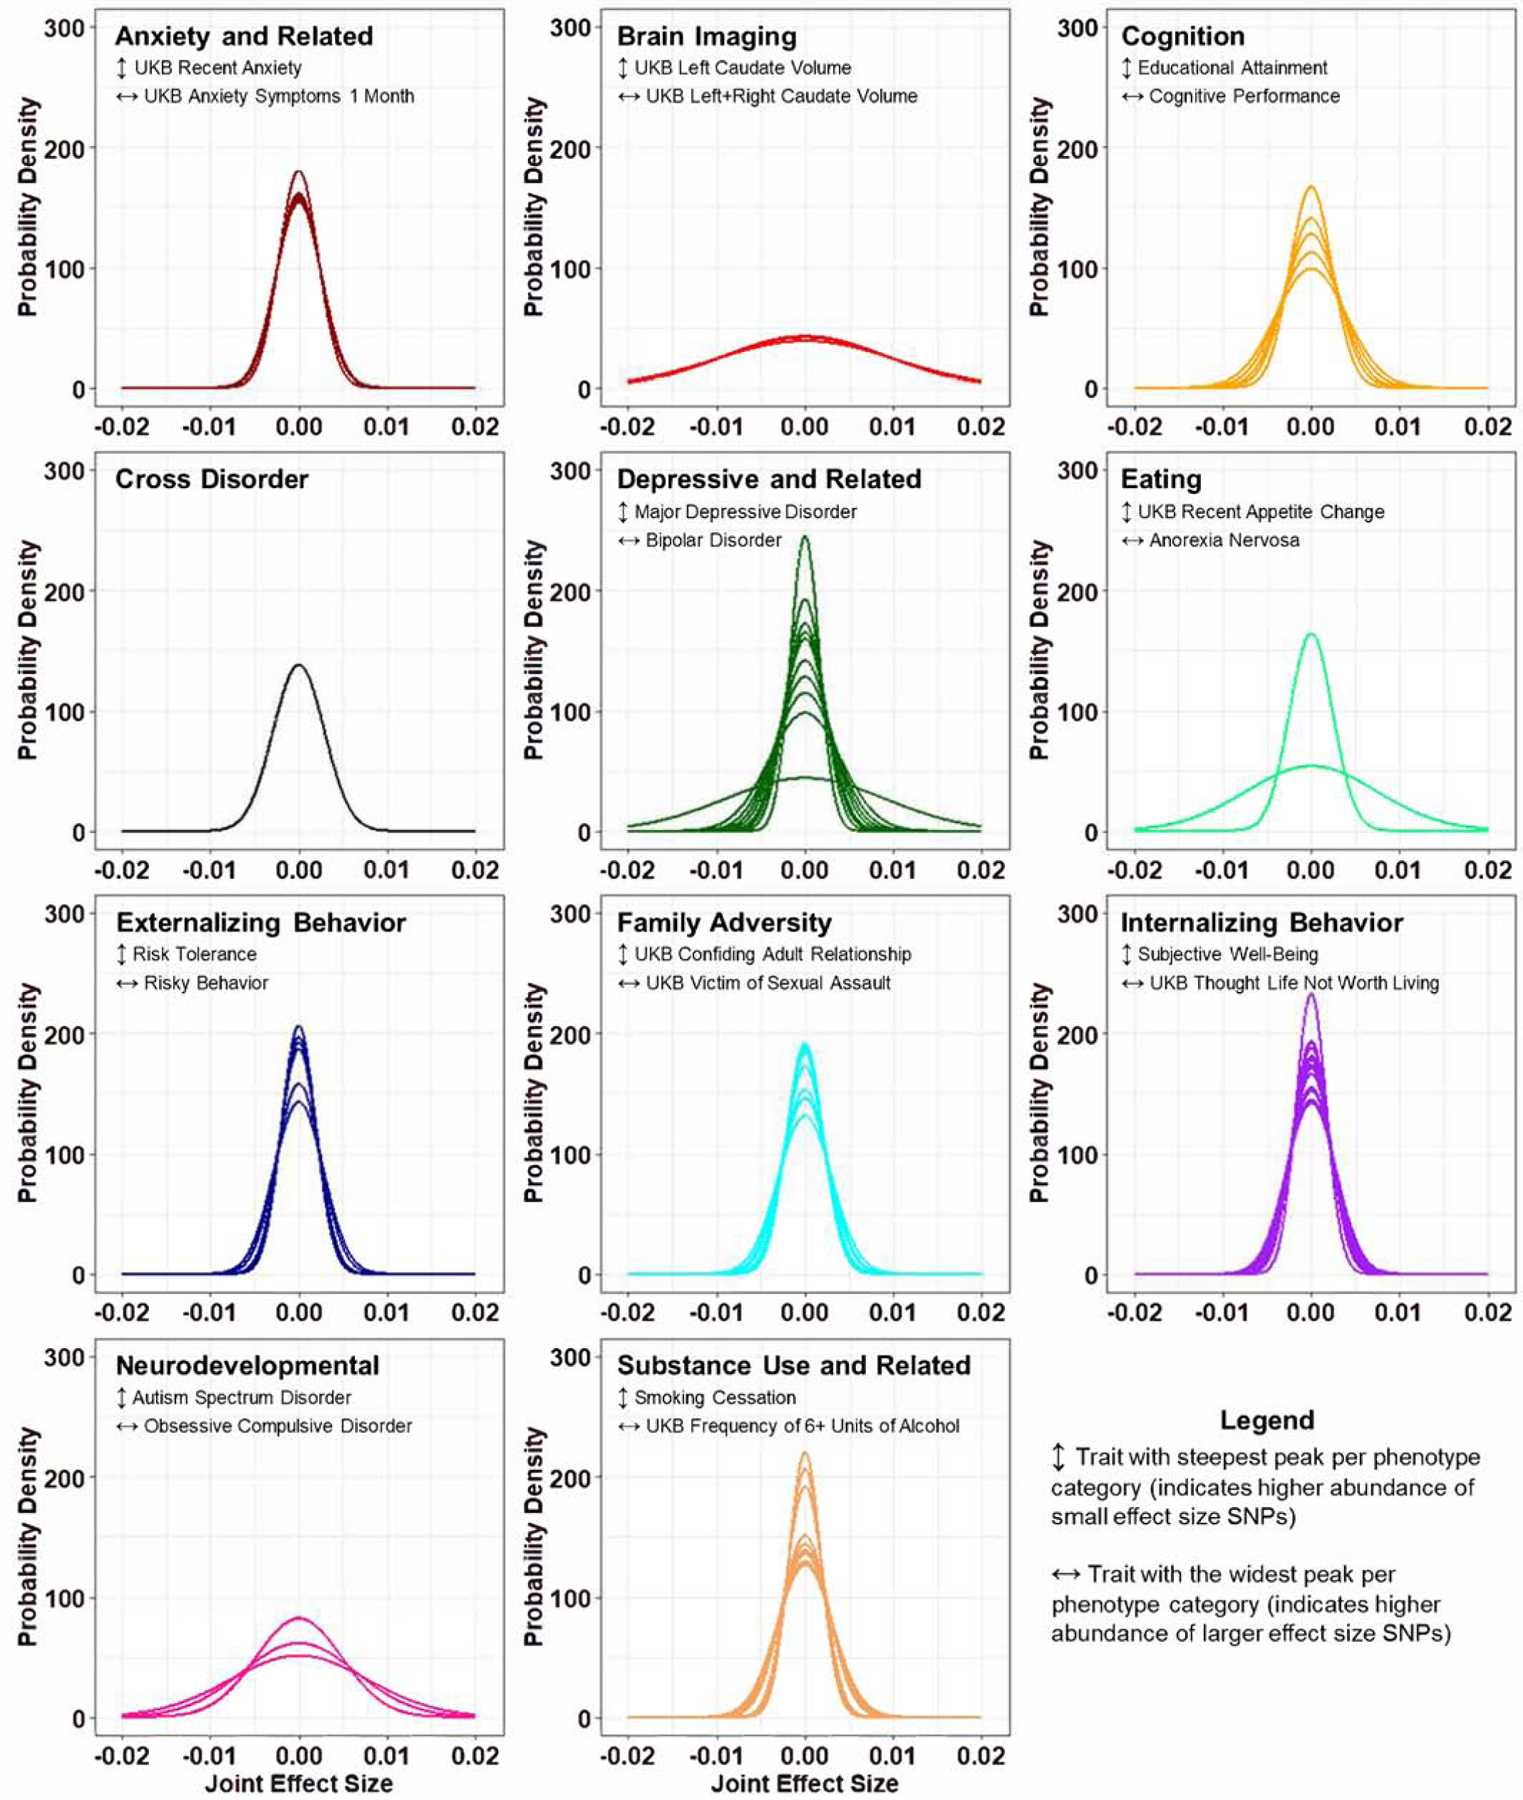
Figure 2. Complex trait effect size distribution curves.

Effect size distribution curves derived from GWAS summary statistics for 75 mental health and disease phenotypes using the GENESIS R package. Phenotypes were grouped into eleven categories (Table S1). The phenotype corresponding to the steepest curve (↕) and the widest curve (↔) are identified in each subplot.
