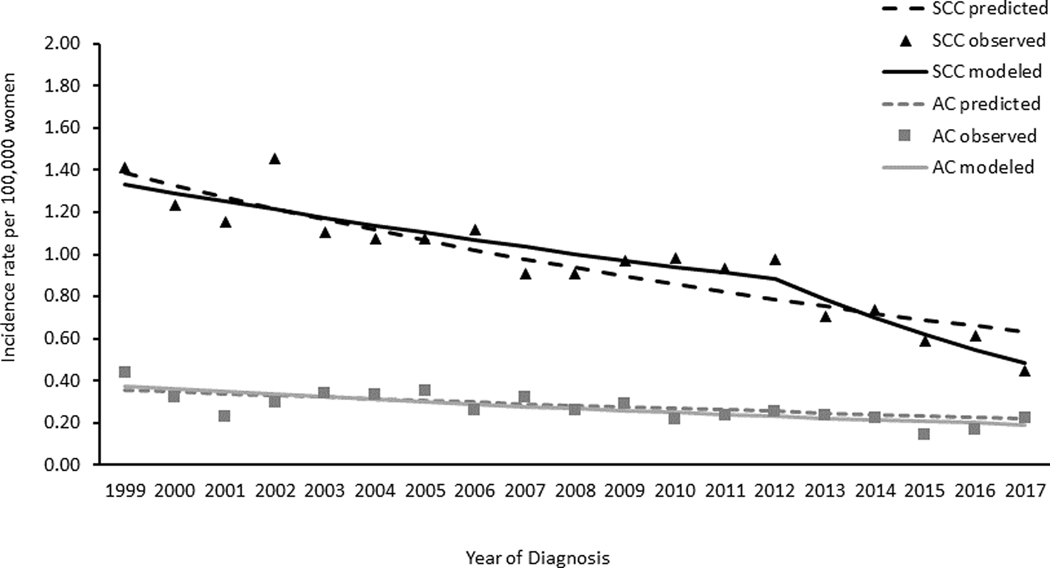
Figure 3. Cervical Cancer Observed and Predicted Incidence Trends among Women Aged 21–24 Years by Histology, United States, 1999–2017.
Data Sources: Center for Disease Control and Prevention’s National Program of Cancer Registries and the National Cancer Institute’s Surveillance, Epidemiology, and End Results Program. Incidence data compiled from cancer registries that met data quality standards from 1999 to 2017, covering 97.8% of the US population. AC refers to adenocarcinomas defined by ICD-O-3 histology codes 8140–8575; SCC refers to squamous cell carcinomas defined by ICD-O-3 histology codes 8050–8084 and 8120–8131. Black triangles represent observed incidence rates of SCC, black solid lines are the SCC modelled trends, black dotted lines are the SCC predicted trends; gray squares represent observed incidence rates of AC, gray dotted lines are the AC modelled trends, gray dotted lines are the AC predicted trends. Predicted rates were estimated based on the trends in 1999 to 2008 continuing to 2017 (see methods section for further information on methodology).

