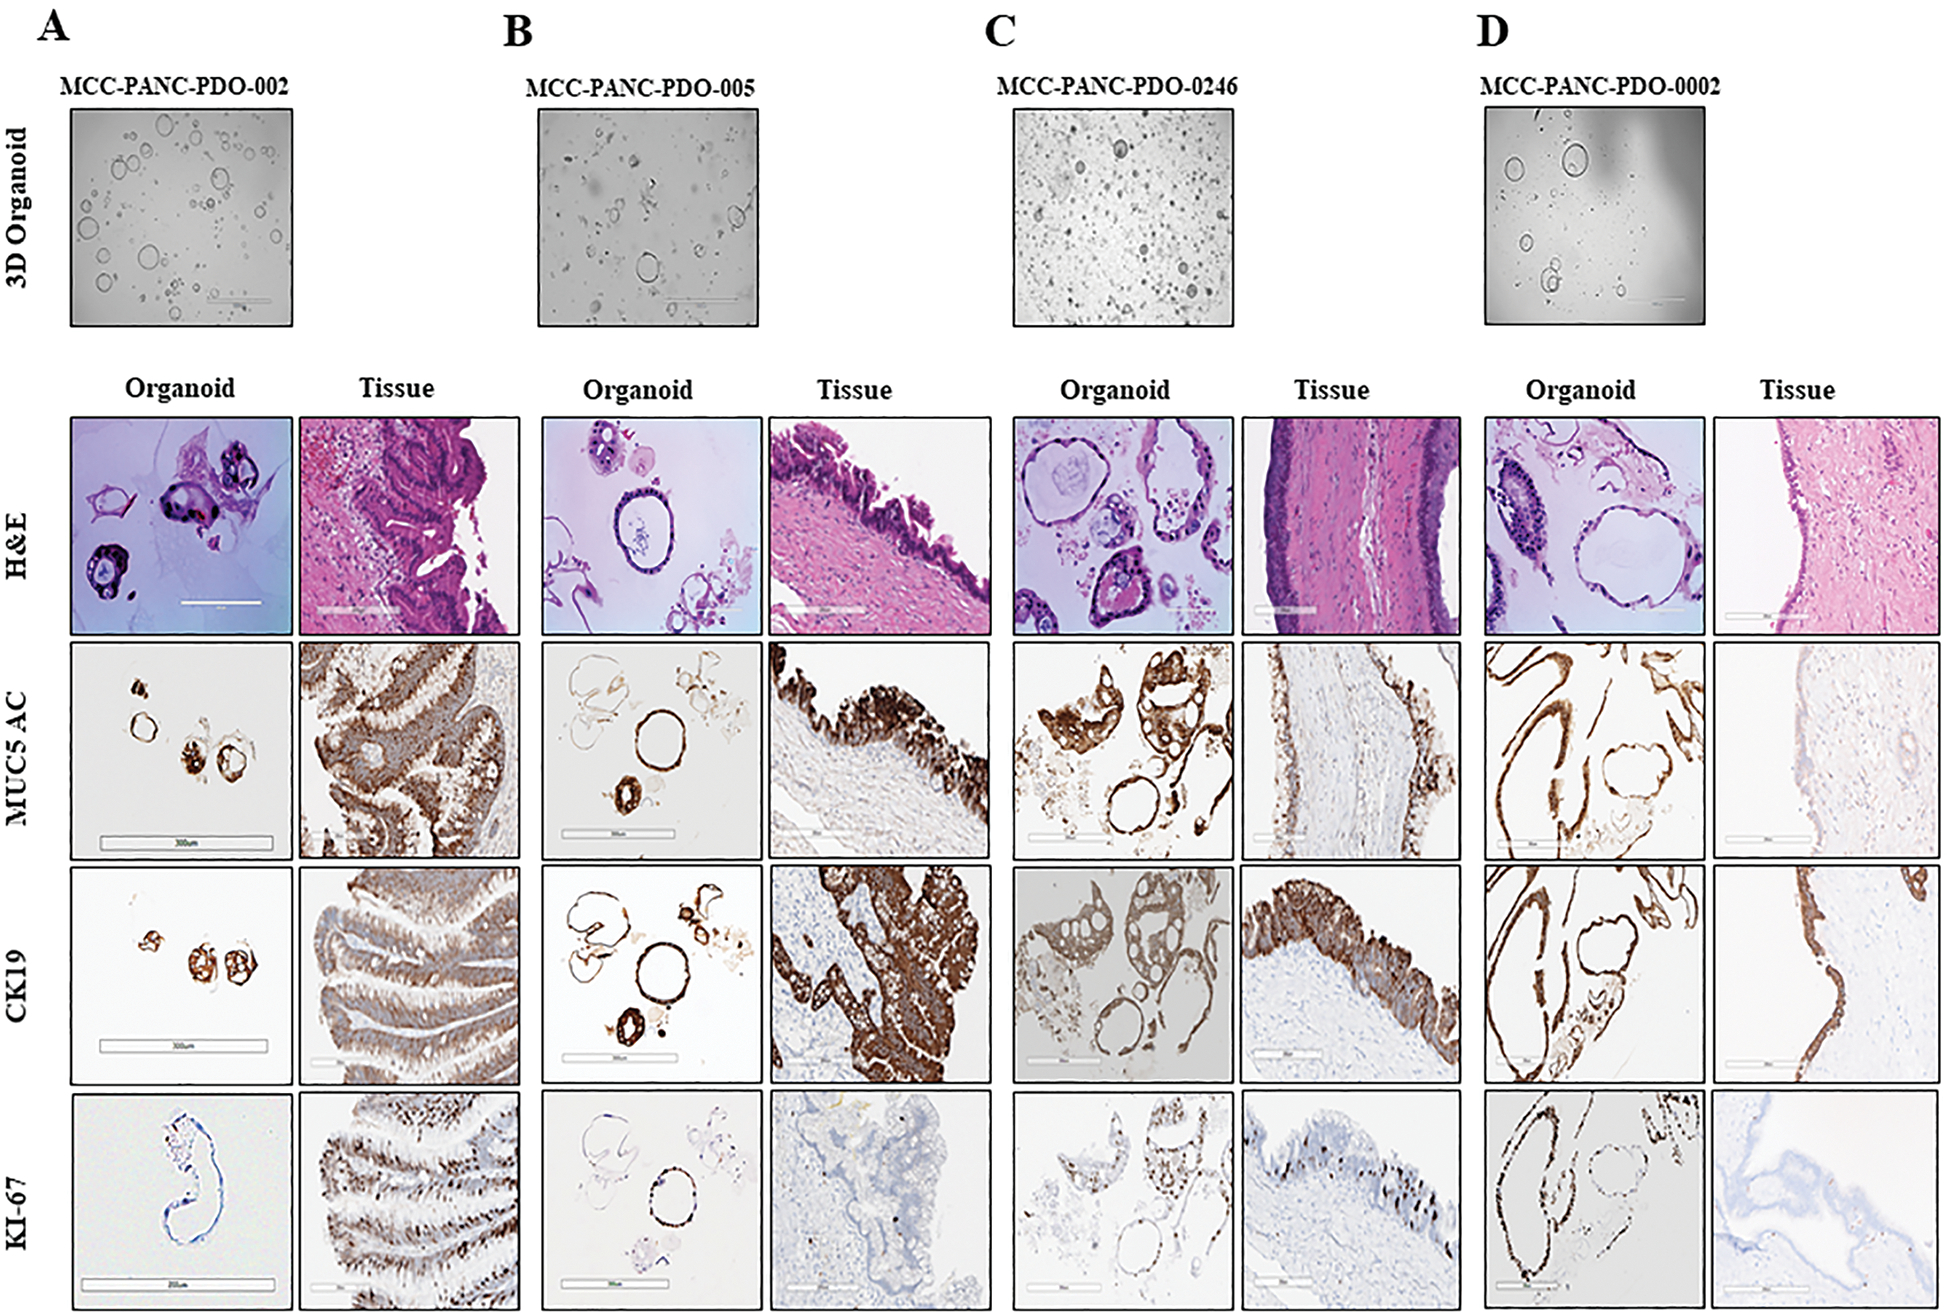
Figure 4. Morphological Analysis of IPMN Tumor Organoids and Primary Tumor.

Morphological analysis of IPMN tumor organoids and primary tumors. Shown are 3D Brightfield images and H&E and immunohistochemical studies for MUC5AC, CK19 and Ki-67 for four IPMN tumor tissue samples and their derived organoids. A. MCC-PANC-PDO-002. The H&E of the tissue shows a low grade IPMN. The organoid shows clusters with a central core surrounded by neoplastic cells. Both the organoid and tissue strongly express MUC5AC, CK19. The tissue has a higher Ki-67 proliferation index than the organoid. B MCC-PANC-PDO-005. Tissue is a high grade IPMN. The organoid grows in clusters. The MUC5AC and CK 19 show a comparable expression level. The organoid cluster shows a higher Ki-67 than the tissue in this field. C. MCC-PANC-PDO-0246. The tissue shows low-grade IPMN. The MUC5AC, CK19 and ki-67 expression levels are similar in the organoid and tissue. D. MCC-PANC-PDO-0002. The tissue shows low grade IPMN with attenuated lining epithelium secondary to previous fine needle aspiration of the cyst. The CK19 expression levels are similar. The MUC5AC shows faint cytoplasmic expressions, but the expression in the organoid is strong. The organoid and tissue show similar expression for CK19. The Ki-67 is higher in the organoid sample.
