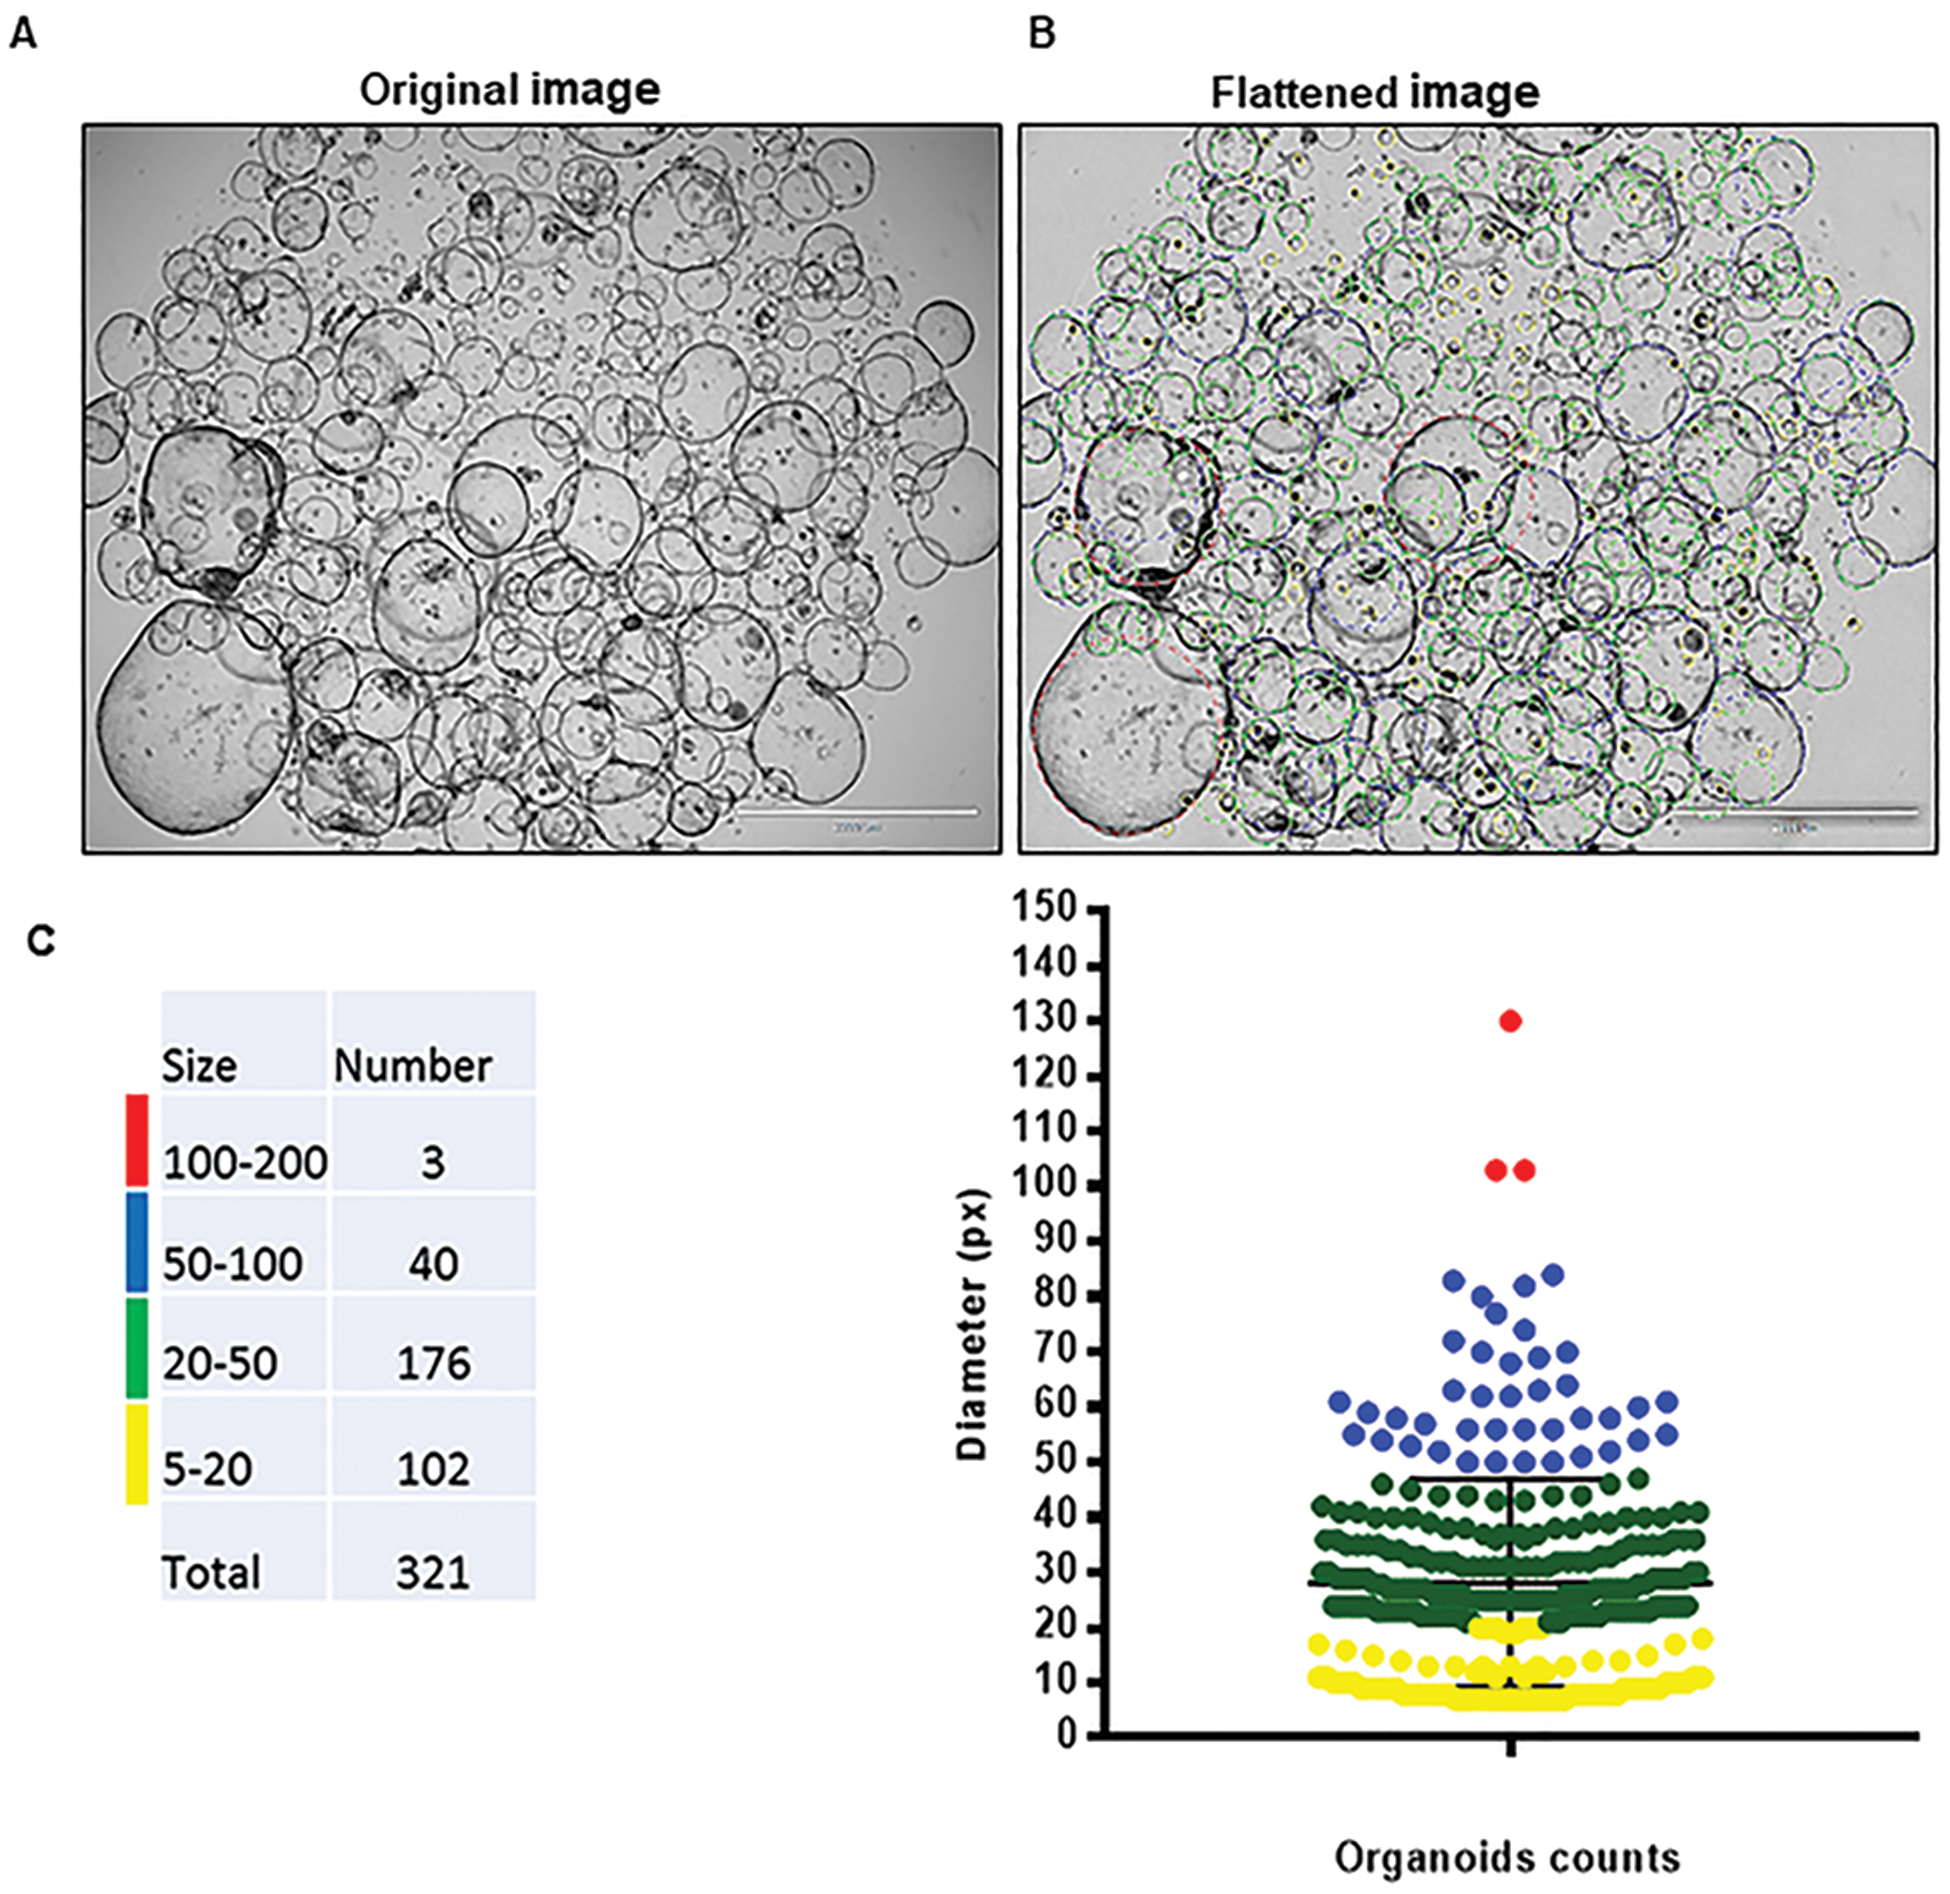
Figure 5. Automated counting of organoids using a Circular Hough Transform (CHT) based algorithm.

Patient-derived organoid culture of low-grade IPMN of pancreatobiliary subtype (MCC-PANC-T0002) was revived, expanded, and passage twice. Image acquired at day 6 post passage. (A) Original image acquired on an EVOS FL Auto Imaging System (1.25x objective) (B) Flattened image and segmentation of detected objects. Scale bar = 2 mm. (C) Distribution of organoids based on count and size. Resulting organoid count color was coded by size (pxls).
