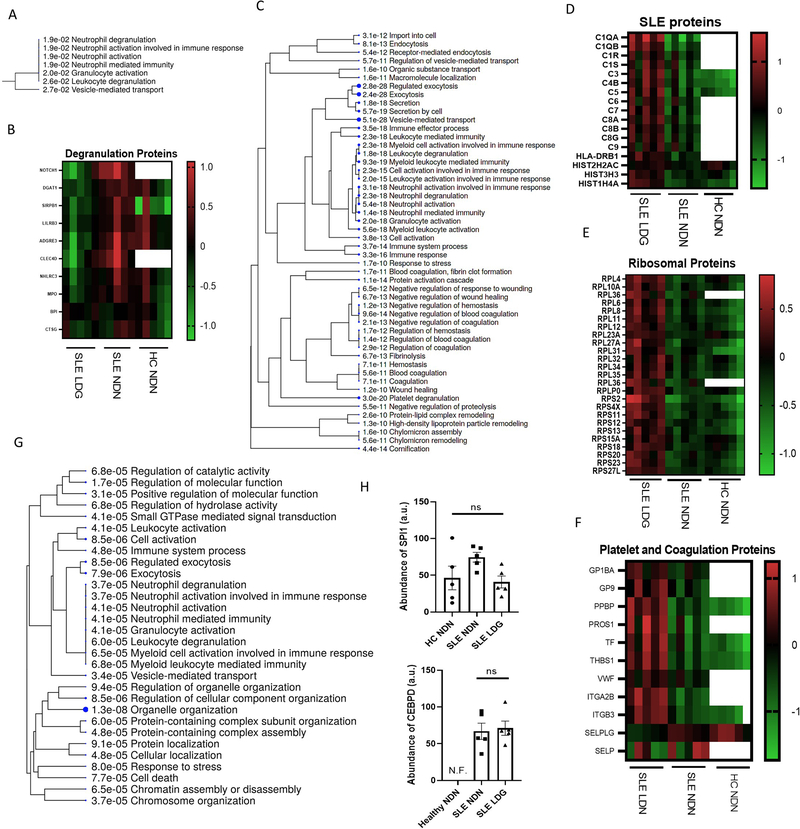
Figure 2. SLE LDGs have a distinct proteomic profile characterized by enhanced pathways associated to translational activity, intracellular trafficking and type I IFN-induced protein pathways.
(A) Gene ontology biological process analysis highlighting biological networks associated with proteins less abundant in SLE LDGs (n=5) relative to SLE NDNs (n=5). Proteins with abundance ratios less than 0.5 in at least 4/5 matched samples were included and significance was established by false discovery rate (FDR). (B) Relative abundance of degranulation network-associated proteins in SLE NDNs and HC NDNs relative to SLE LDGs. SLE NDNs were compared to autologous SLE LDGs. HC NDNs were compared to the mean protein abundance in SLE LDGs. (C) Gene ontology biological process analysis highlighting biological networks associated with proteins more abundant in at least 4/5 SLE LDG samples relative to SLE NDNs. Proteins with abundance ratios greater than 1.5 were included and significance was established by false discovery rate (FDR). (D) Relative abundance of SLE network-associated proteins in SLE NDNs and HC NDNs relative to SLE LDGs. SLE NDNs were compared to autologous SLE LDGs. HC NDNs were compared to the mean protein abundance in SLE LDGs. (E) Relative abundance of eukaryotic translation network-associated proteins in SLE NDNs and HC NDNs relative to SLE LDGs. SLE NDNs were compared to autologous SLE LDGs. HC NDNs were compared to the mean protein abundance in SLE LDGs. Open boxes in heatmaps indicate the given protein was not identified in the sample. (F) Relative abundance of coagulation and platelet network-associated proteins in SLE NDNs and HC NDNs relative to SLE LDGs. SLE NDNs were compared to autologous SLE LDGs. HC NDNs were compared to the mean protein abundance in SLE LDGs. (G) Gene ontology biological process analysis highlighting biological networks associated with phosphoproteins differentially abundant in SLE LDGs and NDNs. Phosphoproteins with abundance ratios less than 0.5 or greater than 1.5 in at least 4/5 matched samples were included and significance was established by false discovery rate (FDR). (H) Abundance of transcription factors CEBPD and SPI1 in arbitrary units. CEBPD not identified in HC NDNs. Results are mean ± SEM, with comparisons between autologous SLE LDG and NDNs. Significance established by Kruskal-Wallis test with post hoc Dunn’s tests for multiple comparisons and set at *p ≤ 0.05, ns=not significant. N.F. = not found.

