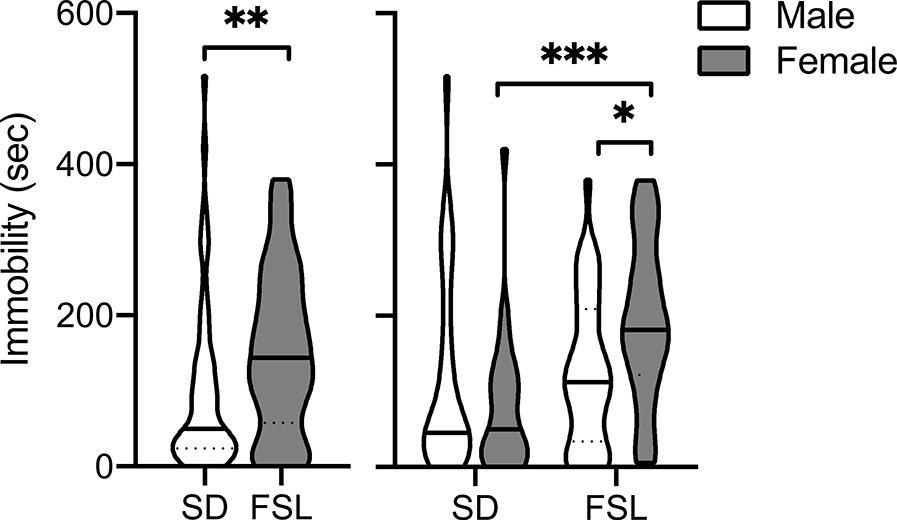
Figure 1.
Violin plots showing the group median (solid line) and interquartile range (dashed lines) of time spent immobile during the 15 min forced swim test in male and female SD and FSL rats (N=52 and 59 for each strain, respectively). The shape of the plot represents the frequency distribution, with the width indicating the frequency of observations at the respective y value. The left panel shows all of the data for each strain. The right panel shows data for each sex in each strain. Significantly different, *p < 0.05, **p < 0.01, ***p < 0.001.

