
Figure 2.
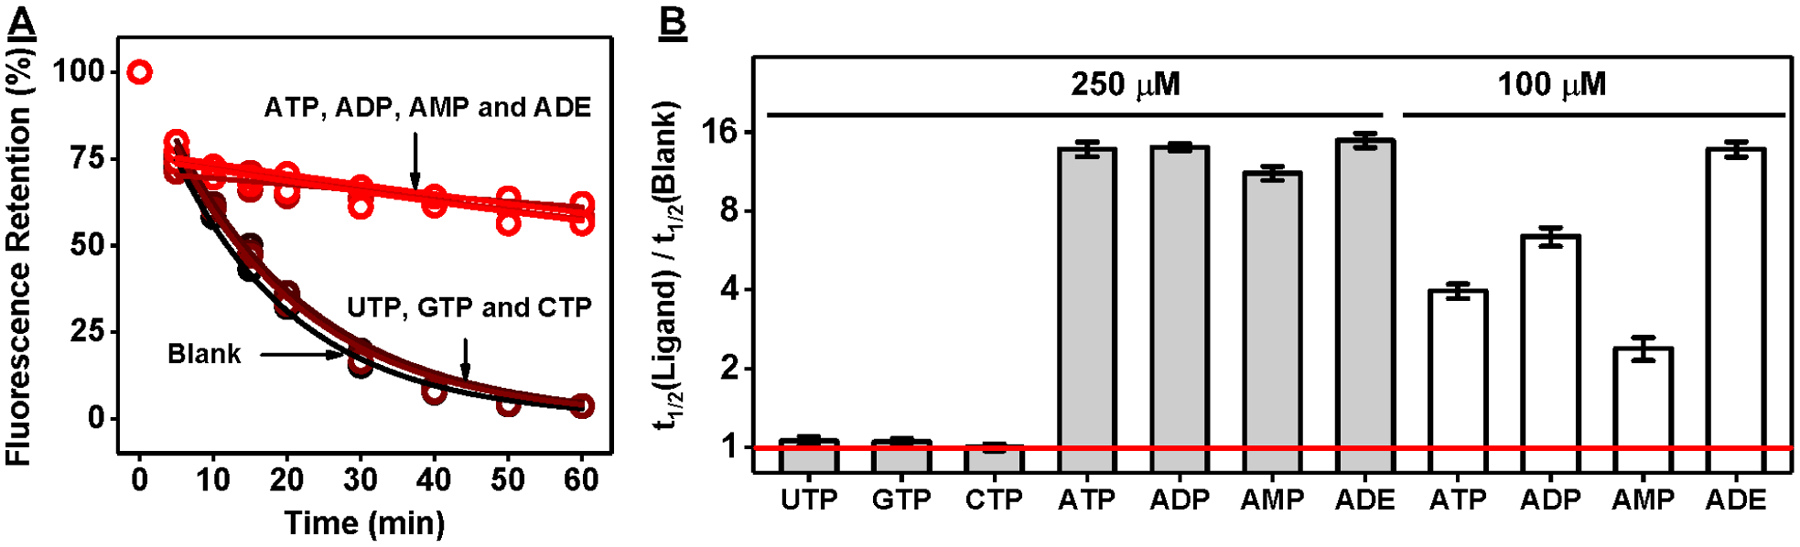
Exonuclease-based fluorescence profiling of ATPwt binding to various targets. (A) Time-course plot of ATPwt digestion by Exo III and Exo I in the absence and presence of various ribonucleotides at a concentration of 250 μM. (B) The t1/2 ratio was used to determine the relative binding affinity to each ligand at 100 and 250 μM. The red line indicates a t1/2 ratio of 1, which reflects no inhibition of aptamer digestion.