Table 6.
Characterization of optimized compounds.
| CMPD No. |
ALDH IC50a (μM) | ADME Characterization | PEO1 Cell ALDEFLUORf (% inhib. @ 1 μM) |
||||||
|---|---|---|---|---|---|---|---|---|---|
| 1A1 | 1A2 | 1A3 | MLMb t1/2 (min) |
Aq. Solc (μM) |
cLogPd | LLEe | |||
| 28 | 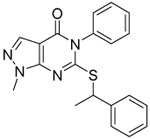 |
0.13 ±0.03 | 0.11 ±0.02 | 0.073 ±0.005 | 8 | 8 | 4.5 | 2.5 | 47 ±5 |
| 422 |  |
0.08 ±0.01 | 0.25 ±0.04 | 0.12 ±0.02 | 23 | 5 | 4.7 | 2.4 | 50 |
| 67 | 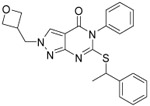 |
0.10 ±0.04 | 0.08 ±0.02 | 0.060 ±0.01 | 19 | 77 | 4.8 | 2.2 | 87 ±3 |
| 68 | 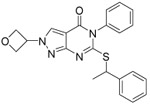 |
0.109 ±0.004 | 0.065 ±0.006 | 0.109 ±0.004 | 47 | 26 | 4.8 | 2.2 | 98 ±0.3 |
| 69 | 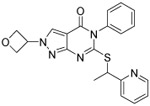 |
0.068 ±0.02 | 0.021 ±0.01 | 0.048 ±0.013 | >60 | 60 | 3.7 | 3.5 | 99 ±0.5 |
| 70 | 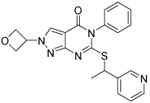 |
0.118 ±0.008 | 0.058 ±0.001 | 0.25 ±0.02 | 2.7 | 189 | 3.6 | 3.3 | 99 ±0.3 |
| 74 | 0.093 ±0.02 | 0.112 ±0.012 | 0.050 ±0.003 | >60 | 19 | 5.1 | 1.9 | 90 ±3 | |
Values are expressed as mean ± SEM (n=3).
Half-life in mouse liver micorosomes.
Thermodynamic aqueous solubility (performed by Analiza Inc. using quantitative nitrogen detection (www.analiza.com)).
Calculated log P.
Lipophilic Ligand Efficiency.
Mean ± SD as determined by flow cytometry (N=3).
