
Figure 4.
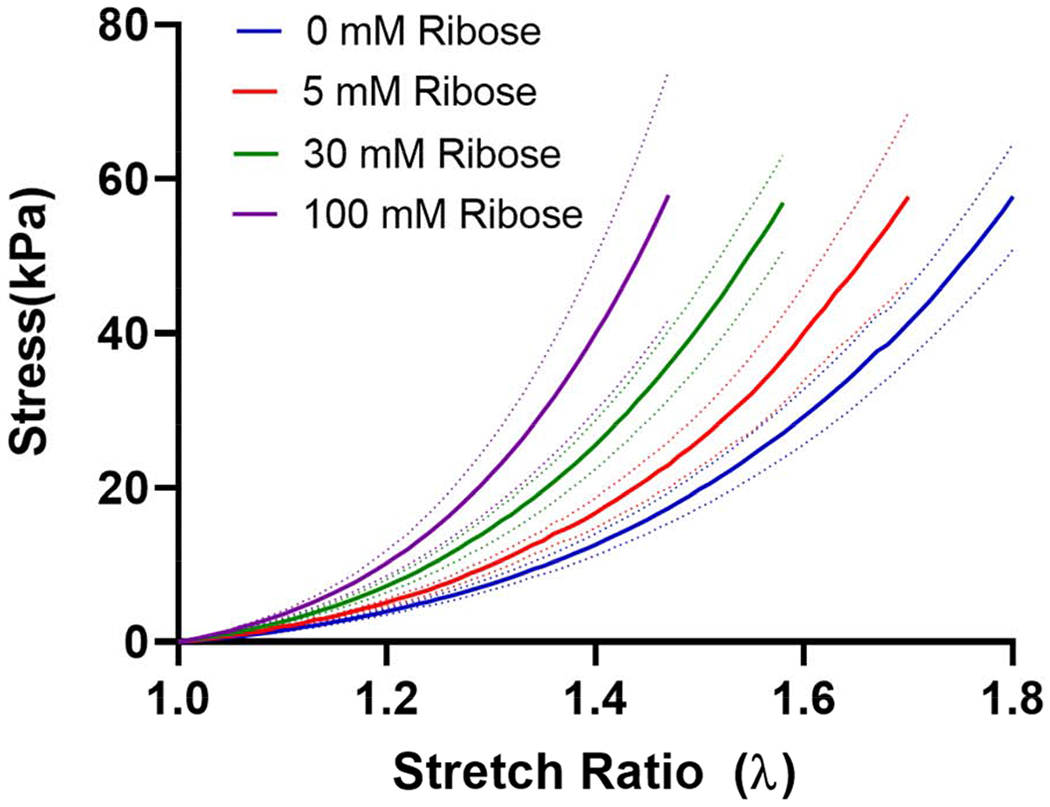
Stress versus stretch ratio for kidney ECM at varying ribose concentrations. Increasing ribose concentrations resulted in an upward shift in the stress-stretch ratio curve. Data are shown as the mean (solid line) ± SEM (dotted lines), n=3 for 5 and 30 mM ribose, n=4 for 0 and 100 mM ribose.