
Figure 2.
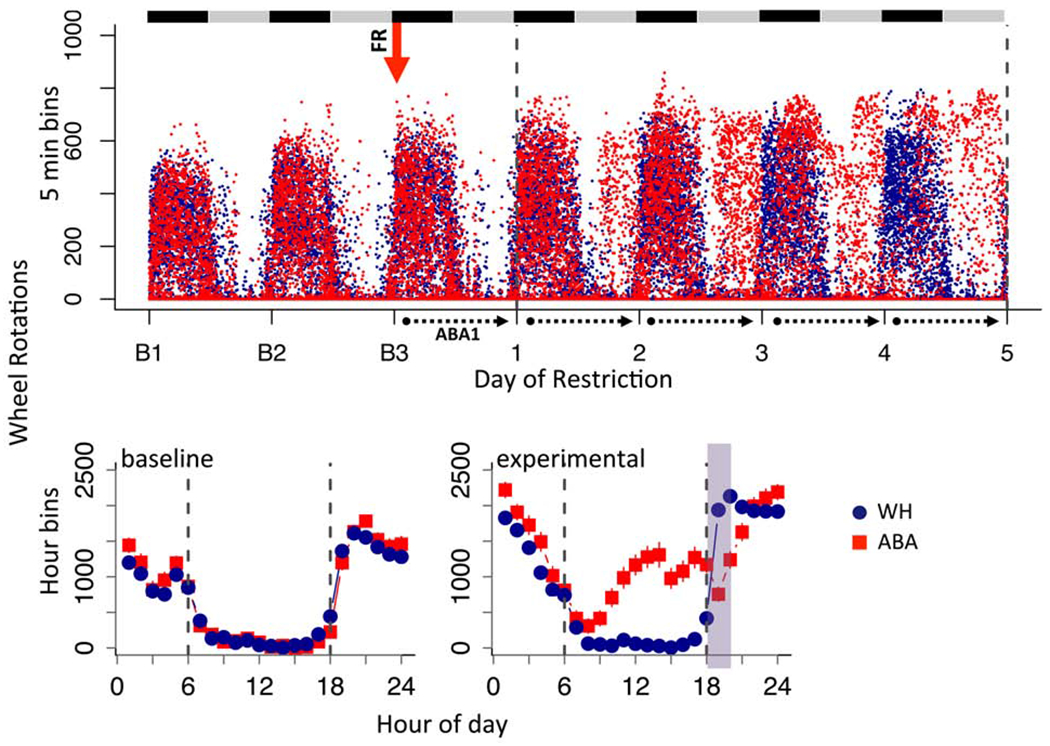
ABA increases light cycle running in adolescent mice. (A) Dot plot of wheel running across days of experiment for all mice in 5 min bins. Black and gray bars indicate dark and light cycles, respectively. Red arrow indicates start of food restriction. Dotted lines demarcate data collection days under ABA. (B) Group averages in hour bins across 24 hour period averaged for (B1) baseline days and (B2) ABA experimental days. Dotted line marks light cycle between 6 (lights on) and 18 (lights off) hrs and green shading indicates when food was available. Error bars, ±SEM.