
Figure 3.
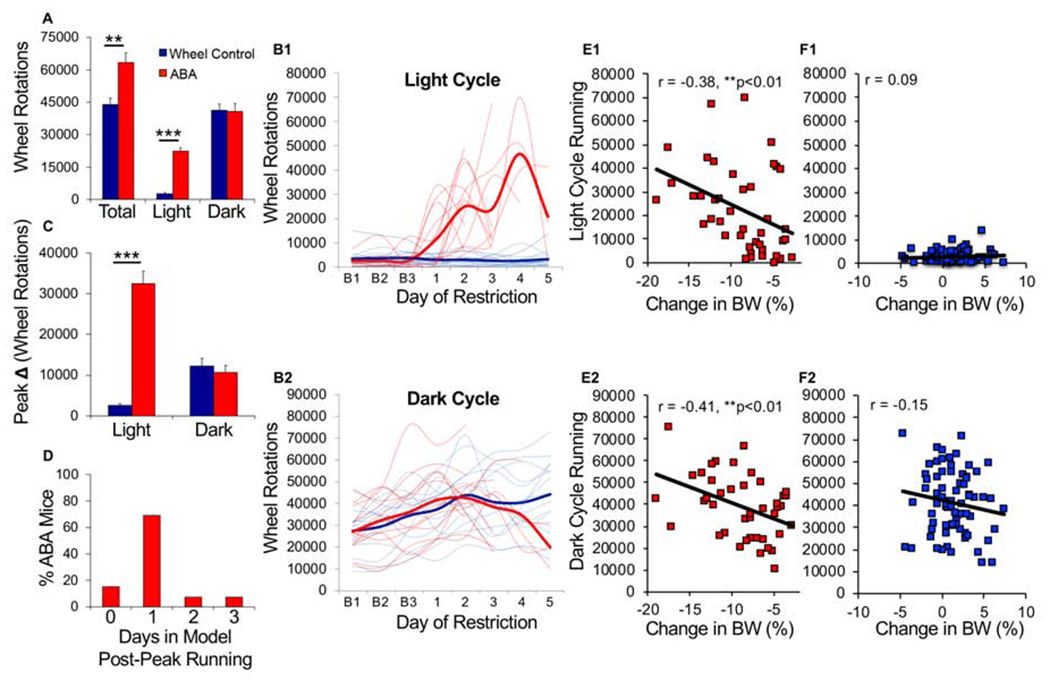
Abrupt increase in light cycle running precedes removal from model. (A) Average wheel activity across days of food restriction. (B) Wheel running of individual mice (light traces) and group mean (bold traces) across food restriction for (B1) light and (B2) dark cycle running. (C) Maximum increase in wheel running across two consecutive days (averaged by group) during the light cycle and dark cycle. (D) Histogram of number of days mice remained in model after maximum increase in light cycle running. (E-F) Correlation between light (top) or dark cycle running (bottom) and change in bodyweight the next day for ABA mice (E1-E2) and wheel control mice (F1-F2). Each symbol represents one animal on one experimental day. n=13 (ABA), n=15 (wheel controls); **p<0.01; ***p<0.001. Error bars, ± SEM.