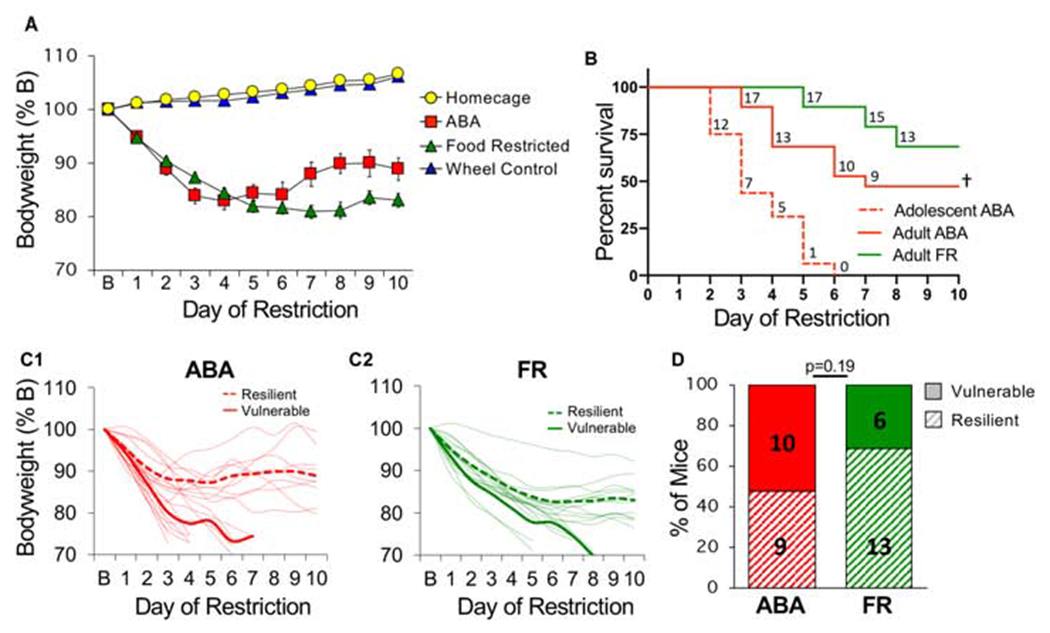
Figure 4.

Young adult female mice exhibit vulnerable and resilient phenotypes. (A) Bodyweight across days of food restriction. (B) Survival curves for each group. Dotted red is replot of adolescent survival from Fig. 1 for reference. Numbers indicate number of surviving mice that day. (C) Body weight of individual mice (light traces) across days of food restriction in (C1) ABA and (C2) FR groups. Group averages for resilient (dashed line) and vulnerable (solid line) mice are shown in bold. (D) Percent of vulnerable (solid) and resilient (hatched) mice within ABA and FR groups (number of animals is indicated inside bars). n=19 (ABA), n=19 (FR), n=12 (homecage), n=14 (wheel controls). †Survival curves, difference between adolescent and adult ABA, p<0.0001. Error bars, ± SEM.
