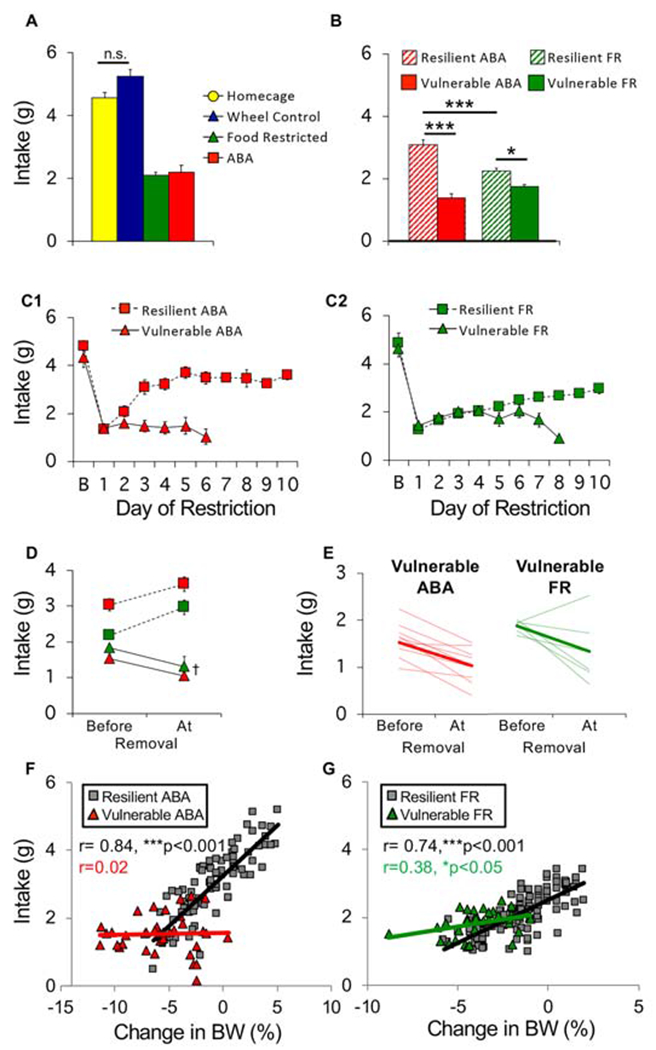
Figure 5.

Resilient mice adapt food intake. (A) Average food intake across 10 days of restriction. (B) Average food intake of vulnerable (solid) and resilient (hatched) mice in ABA and food restricted (FR) groups. (C) Daily food intake of (C1) ABA and (C2) FR mice across days of restriction. (D) Average and (E) individual (light traces) food intake of ABA and FR mice prior to removal versus the day of removal (bold lines in E show group average). Correlation between consumption during restricted access to food and changes in body weight the next day for (F) ABA and (G) FR mice. Each symbol represents one animal on one experimental day. n=9 (resilient ABA), n=10 (vulnerable ABA), n=13 (resilient FR), n=6 (vulnerable FR), n=12 (homecage), n=14 (wheel controls). *p<0.05, ***p<0.001, †p<0.01. Error bars, ± SEM.
