Figure 3:

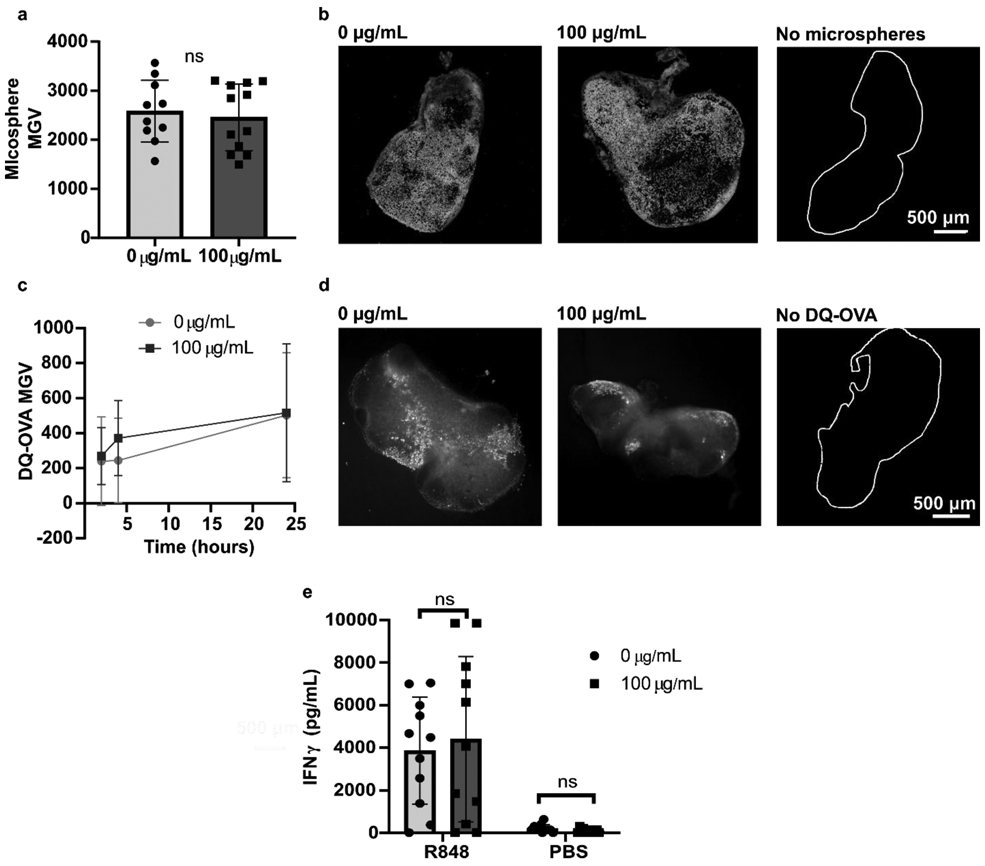
Digitonin wash step does not impact slice function. (a) Mean grey value (MGV) of 2-μm microsphere fluorescence in naïve slices collected with and without a digitonin wash (100 μg/mL), used as a metric of bead uptake. The MGV of each slice was background subtracted by the MGV of a separate set of slices that received no microspheres. ns indicates p > 0.05 by unpaired t test. Each dot represents one slice (n = 10 – 12). Bars show mean with standard deviation. (b) Representative images of microsphere uptake, with and without a digitonin wash. The white trace identifies the outline of a LN slice that received flow buffer instead of microspheres. (c) MGV of DQ-OVA in naïve lymph node slices collected with and without a digitonin wash, used as a metric of antigen uptake, and (d) representative images of DQ-OVA processing at 24 hours. The white trace identifies the outline of a LN slice that received OVA instead of DQ-OVA. Dots show mean and standard deviation. n = 15 for 100 μg/mL; n = 9 for 0 μg/mL. (e) IFNγ concentration in culture supernatant was not significantly different between unwashed and digitonin-washed slices after overnight stimulation with R848. Analyzed by two-way ANOVA. Each dot represents one slice (n = 11). Bars show mean with standard deviation. ns indicates p > 0.05 by unpaired 2-way ANOVA.
