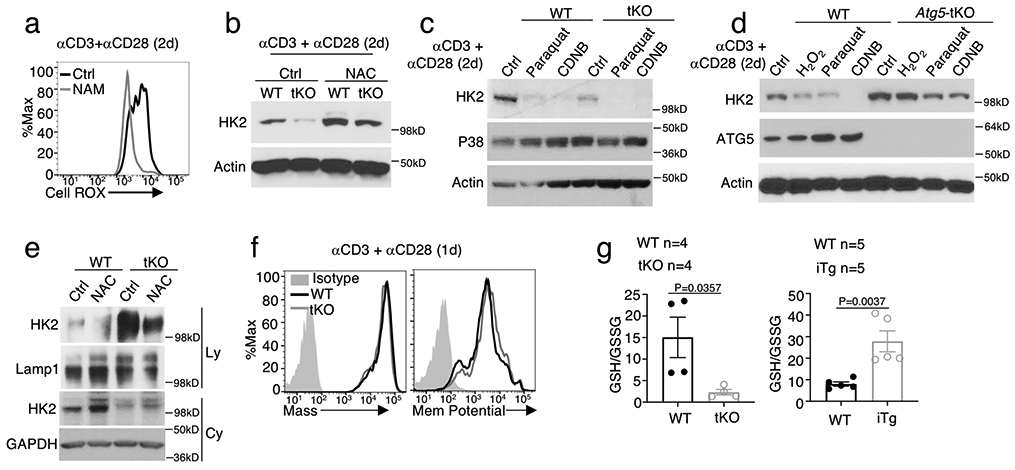
Extended Data Fig. 7. ROS is involved in HK2 degradation in NIK-deficient CD8 T cells.

a, Flow cytometric analysis of ROS levels in Map3k14tKO OT-I CD8 T cells activated with anti-CD3 plus anti-CD28 for 48h in the presence of NAM or solvent control DMSO. b,c, Immunoblot analysis of HK2 expression in Map3k14tKO (tKO) or wildtype (WT) OT-I CD8 T cells activated with anti-CD3 plus anti-CD28 for 48h in the presence of the antioxidant N-acetylcysteine (NAC) or medium control (b) or the indicated ROS inducers and DMSO control (c). d, Immunoblot analysis of HK2 in wildtype (WT) or Atg5-tKO CD8 T cells activated with anti-CD3 plus anti-CD28 for 48h in the presence of the indicated ROS inducers or medium control. e, Immunoblot analysis of HK2 and the indicated loading controls in lysosomal (Ly) and cytoplasmic (Cy) fractions of wildtype (WT) and Map3k14tKO CD8 T cells activated with anti-CD3 plus anti-CD28 for 48 h in the presence of NAC or medium control. f, Flow cytometry analysis of the mass and membrane potential of mitochondria in wildtype (WT) and Map3k14tKO (tKO) CD8 T cells stimulated with anti-CD3 plus anti-CD28 for 24 h. g, Ratio of reduced (GSH) and oxidized (GSSG) forms of glutathione in Map3k14tKO (upper), NIKiTg (lower), or wildtype (WT) control OT-I CD8 T cells activated in vitro with anti-CD3 plus anti-CD28 for 48 h. Data are representative of three independent experiments. Summary data are shown as mean ± s.e.m. with P values determined by two-tailed Student’s t test.
