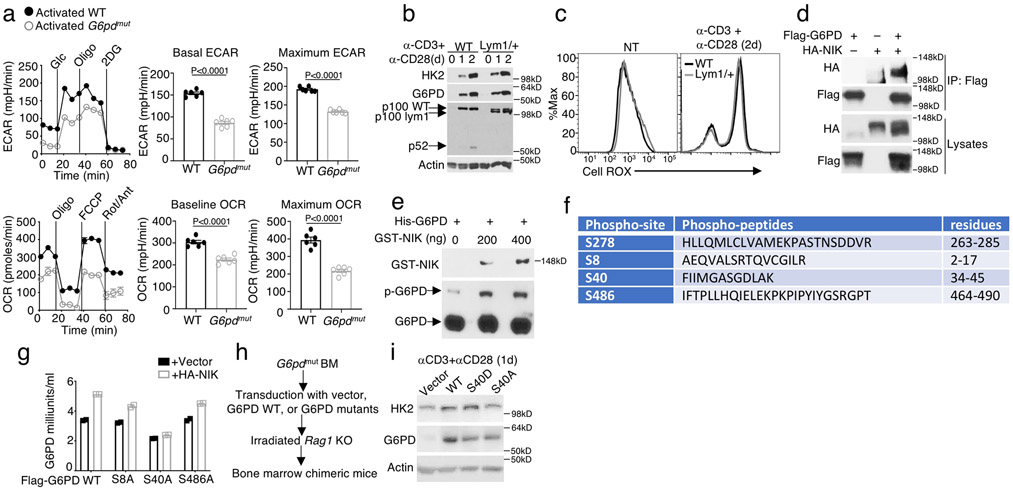
Extended Data Fig. 8. G6PD phosphorylation by NIK and role in regulating HK2 expression and T cell metabolism.
a, Seahorse analysis of basal ECAR (measured after glucose injection, Glc) and maximum ECAR (measured after oligomycin injection, Oligo) and Seahorse analysis of baseline OCR (no treatment) and maximum OCR (FCCP injection) in G6PDmut or wildtype (WT) control T cells activated by anti-CD3 plus anti-CD28 for 48 h. b,c, Immunoblot analysis of the indicated proteins (b) and ROS detection (c) in wildtype or Nfkb2lym1/+ (Lym1/+) CD8 T cells, which were either not treated (NT) or stimulated with anti-CD3 plus anti-CD28 for the indicated time periods. d, CoIP analysis of NIK-G6PD interaction (upper) and immunoblot analysis of HA-NIK and Flag-G6PD expression in whole-cell lysates (WCL) of 293 cells transfected with (+) or without (−) Flag-G6PD and HA-NIK. e, Phos-tag SDS PAGE and Immunoblot analysis of phosphorylated (p-) and total G6PD as well as GST-NIK in an in vitro kinase assay mix containing 500 ng recombinant His-G6PD and the indicated amounts of recombinant GST-NIK. f, NIK-induced G6PD phosphorylation sites identified by mass spectrometry analysis of G6PD phosphorylated in vitro by NIK. g, G6PD activity in 293T cells transiently transfected with Flag-tagged wildtype G6PD or the indicated G6PD mutants along with either an empty vector or HA-NIK. h,i, Schematic of experimental design (h) and immunoblot analysis of G6PD expression in T cells isolated from bone marrow chimeric mice constructed using G6PDmut bone marrow cells reconstituted with either an empty vector (Vector) or the indicated G6PD expression vectors (i). For a and g, data are shown as representative plots, each circle represents a well. Data are representative of one (f) or three (a-e,g-i) independent experiments. Summary data are shown as mean ± s.e.m. with P values determined by two-tailed Student’s t test.

