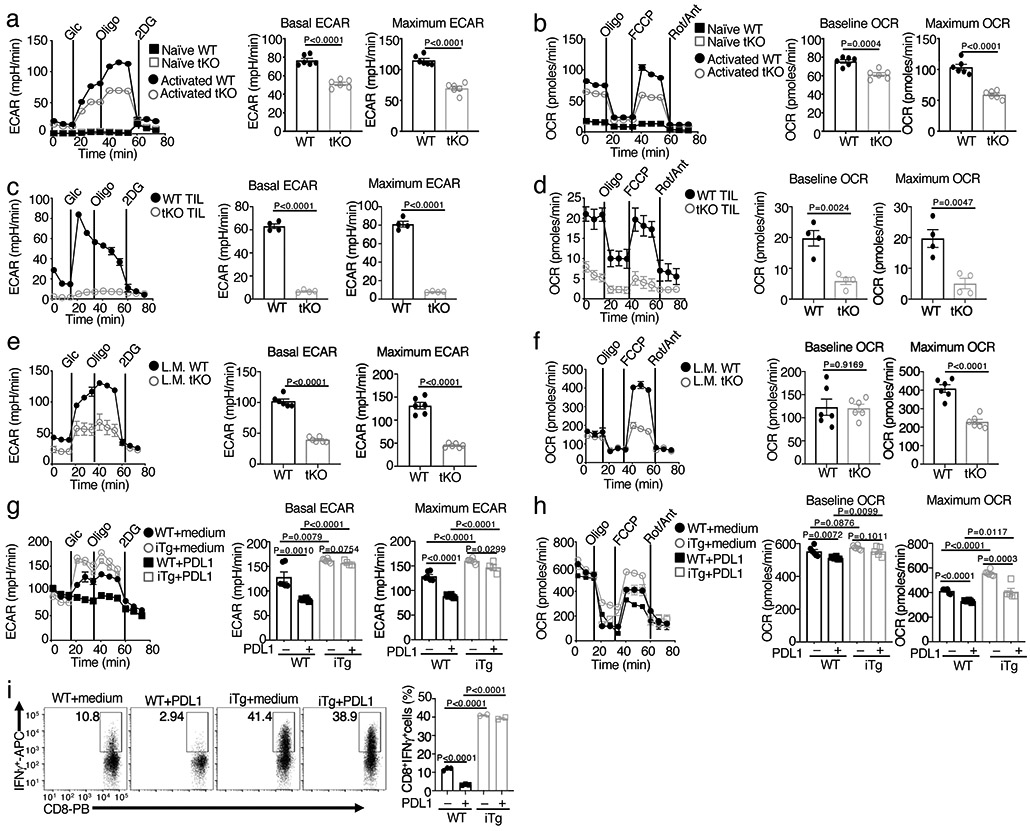
Figure 3. NIK regulates metabolic reprogramming along with T cell activation both in vivo and in vitro.

a,b, Seahorse analysis of basal ECAR (measured after glucose injection, Glc) and maximum ECAR (measured after oligomycin injection, Oligo) conditions (a) and Seahorse analysis of baseline OCR (no treatment) and maximum OCR (FCCP injection) (b) in Map3k14tKO (tKO) or wildtype (WT) control OT-I CD8+ T cells, either naive or activated by anti-CD3 plus anti-CD28 for 24 h. c,d, Seahorse analysis of ECAR (c) and OCR (d), as described in a and b, using total T cells isolated from day 16 tumor of B16F10-implanted wildtype (WT) or Map3k14tKO (n=5) and activated with anti-CD3 and anti-CD28 for 24 h. e,f, Seahorse analysis of ECAR (e) and OCR (f) using OT-I CD8+ T cells freshly isolated from the spleen of day 7 L. monocytogenes (L.M.)-infected wildtype (WT) or Map3k14tKO mice without in vitro activation (n=3). g,h, Seahorse analysis of ECAR (g) and OCR (h) using wildtype (WT) or NIKiTg CD8+ T cells activated for 72 h with anti-CD3 plus anti-CD28 in the presence of 4OH-tamoxifen (0.2 μg/ml, to induce CreER-mediated NIK expression), followed by treatment with PDL1 (0.5 μg/ml) or medium for 24 h. i, Flow cytometric analysis of intracellular IFN-γ in wildtype (WT) or NIKiTg CD8+ T cells activated for 72 h with anti-CD3 plus anti-CD28 in the presence of the CreER inducer 4OH-tamoxifen as in (f), followed by treatment with soluble PDL1 or medium for 24 h. Data are representative of three independent experiments. Summary data are shown as mean ± s.e.m. based on multiple wells (a-h, each circle represents a well) or mice (i, each circle represents a mouse), with P values determined by two-tailed Student’s t test.
