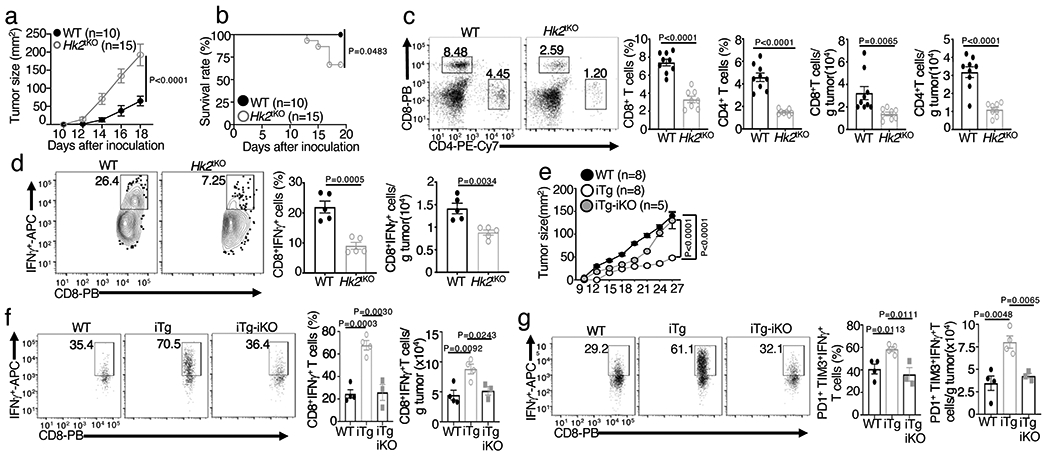
Figure 5. HK2 is required for antitumor immunity.

a,b, Tumor growth (a) and survival (b) curves of Hk2tKO or wildtype (WT) control mice injected s.c. with 105 B16F10 melanoma cells for the indicated time periods. c,d, Flow cytometric analysis of the frequency and absolute number of CD4+ and CD8+ T cells (c) and IFN-γ-producing CD8+ effector T cells (d) in day 20 tumor of the B16F10-implanted Hk2tKO and wildtype control mice (c,WT: n=9; Hk2tKO: n=8; d, n=5 per genotype). e, Tumor growth curve of MC38 tumor-bearing wildtype, NIKiTg (iTg), and NIKiTgHk2iKO (iTg-iKO) mice. f,g, Flow cytometric analysis of the frequency and absolute cell number of IFN-γ-producing CD8+ T cells (f) and gated PD1+Tim3+ CD8+ T cells (g) in day-27 tumor of the MC38 tumor-bearing mice (f,g, WT: n=4, iTg: n=4, iTg-iKO: n=3) . Data are representative of two (e-g) or three (a-d) independent experiments. Flow cytometry data are presented as representative plots (left) and summary graphs (mean ± s.e.m.) based on multiple mice (right, each circle represents an individual mouse). P values were determined by two-way analysis of ANOVA with Bonferroni correction (a,e), two-tailed Student’s t test (c,d,f,g) or two sided log- rank test (b).
