
FIGURE 5.
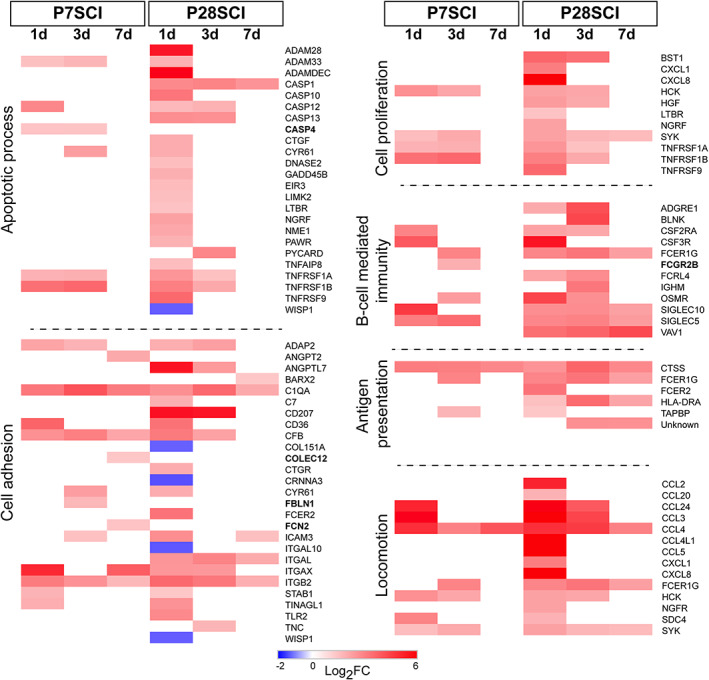
Individual genes classified in key functional categories in only nonregenerating injury groups. The genes that were classified in GO slim categories that were overrepresented only after injury in P28SCI animals are shown along with their fold changes. Bold gene names indicate those that only appear in P7SCI data sets. Note: Some genes are classified in multiple groups [Color figure can be viewed at wileyonlinelibrary.com]