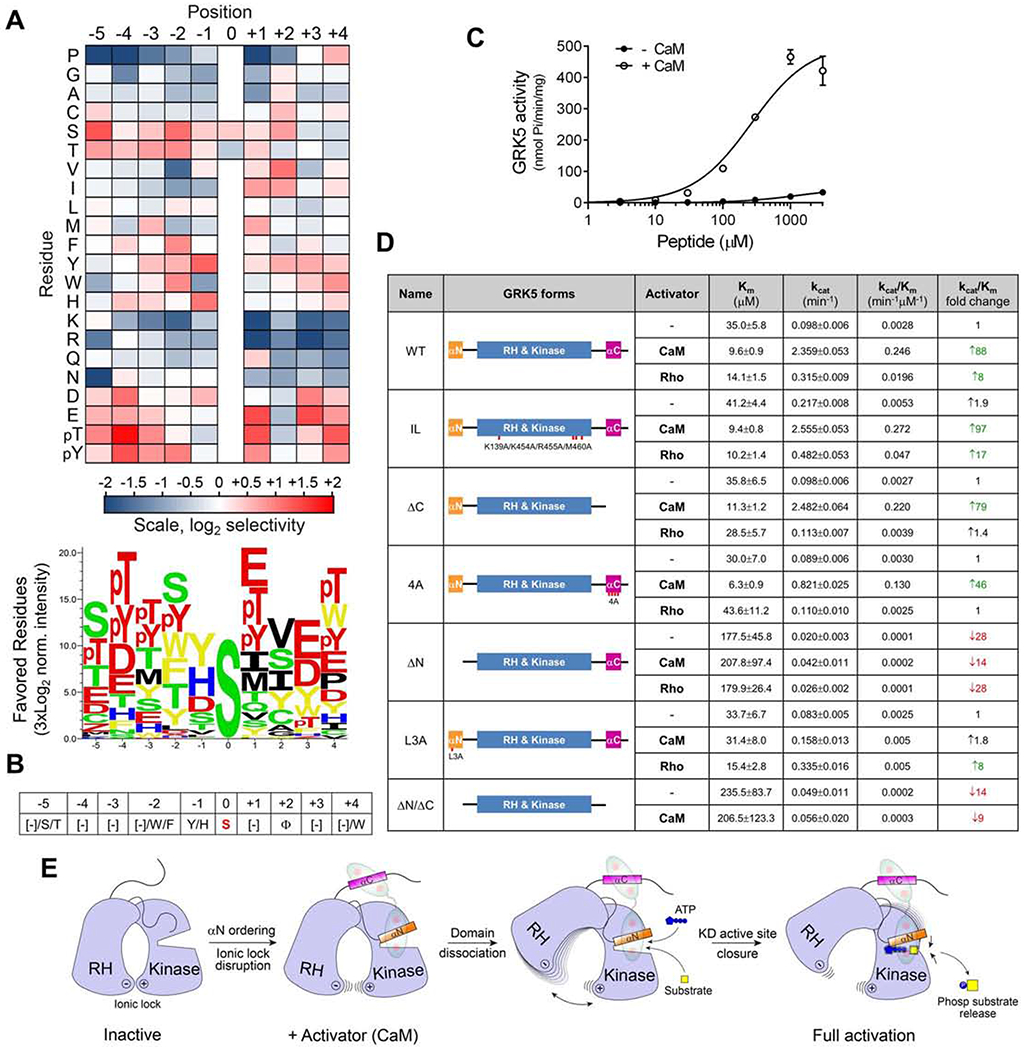
Figure 4. GRK5 substrate specificity profiling and enzymatic analysis identify key elements critical for CaM-mediated activation and substrate targeting.

(A) Substrate specificity profiling of GRK5 bound to CaM (+CaM). Quantified PSPA spot intensities were normalized to an average value of 1 at each position within the peptide. Log2 transformed data are depicted as heat maps showing positively (red) and negatively (blue) selected residues by position. Data are the mean of two separate experiments. Sequence logo below the heat map shows positively selected residues from PSPA. See also Figure S5A.
(B) Consensus motif for GRK5 phosphorylation as revealed by PSPA analysis.
(C) Kinetic plots for AEMWYSEVEEARRR phosphorylation by GRK5 with or without CaM. Data are presented as mean ± SEM, n=3.
(D) Enzymatic parameters for WT or mutant GRK5-mediated phosphorylation of AEMWYSEVEEARRR at different ATP concentrations under basal (−), CaM-activated (CaM) or Rho-activated (Rho) conditions. The data are from three experiments and fitted to Michaelis-Menten kinetics. Data are presented as mean ± SD, n>3. See also Figure S5D.
(E) Cartoon for GRK5 activation by CaM illustrating possible steps in the progression of GRK5 from an initial inactive conformation to a fully-active state.
See also Figure S5.
