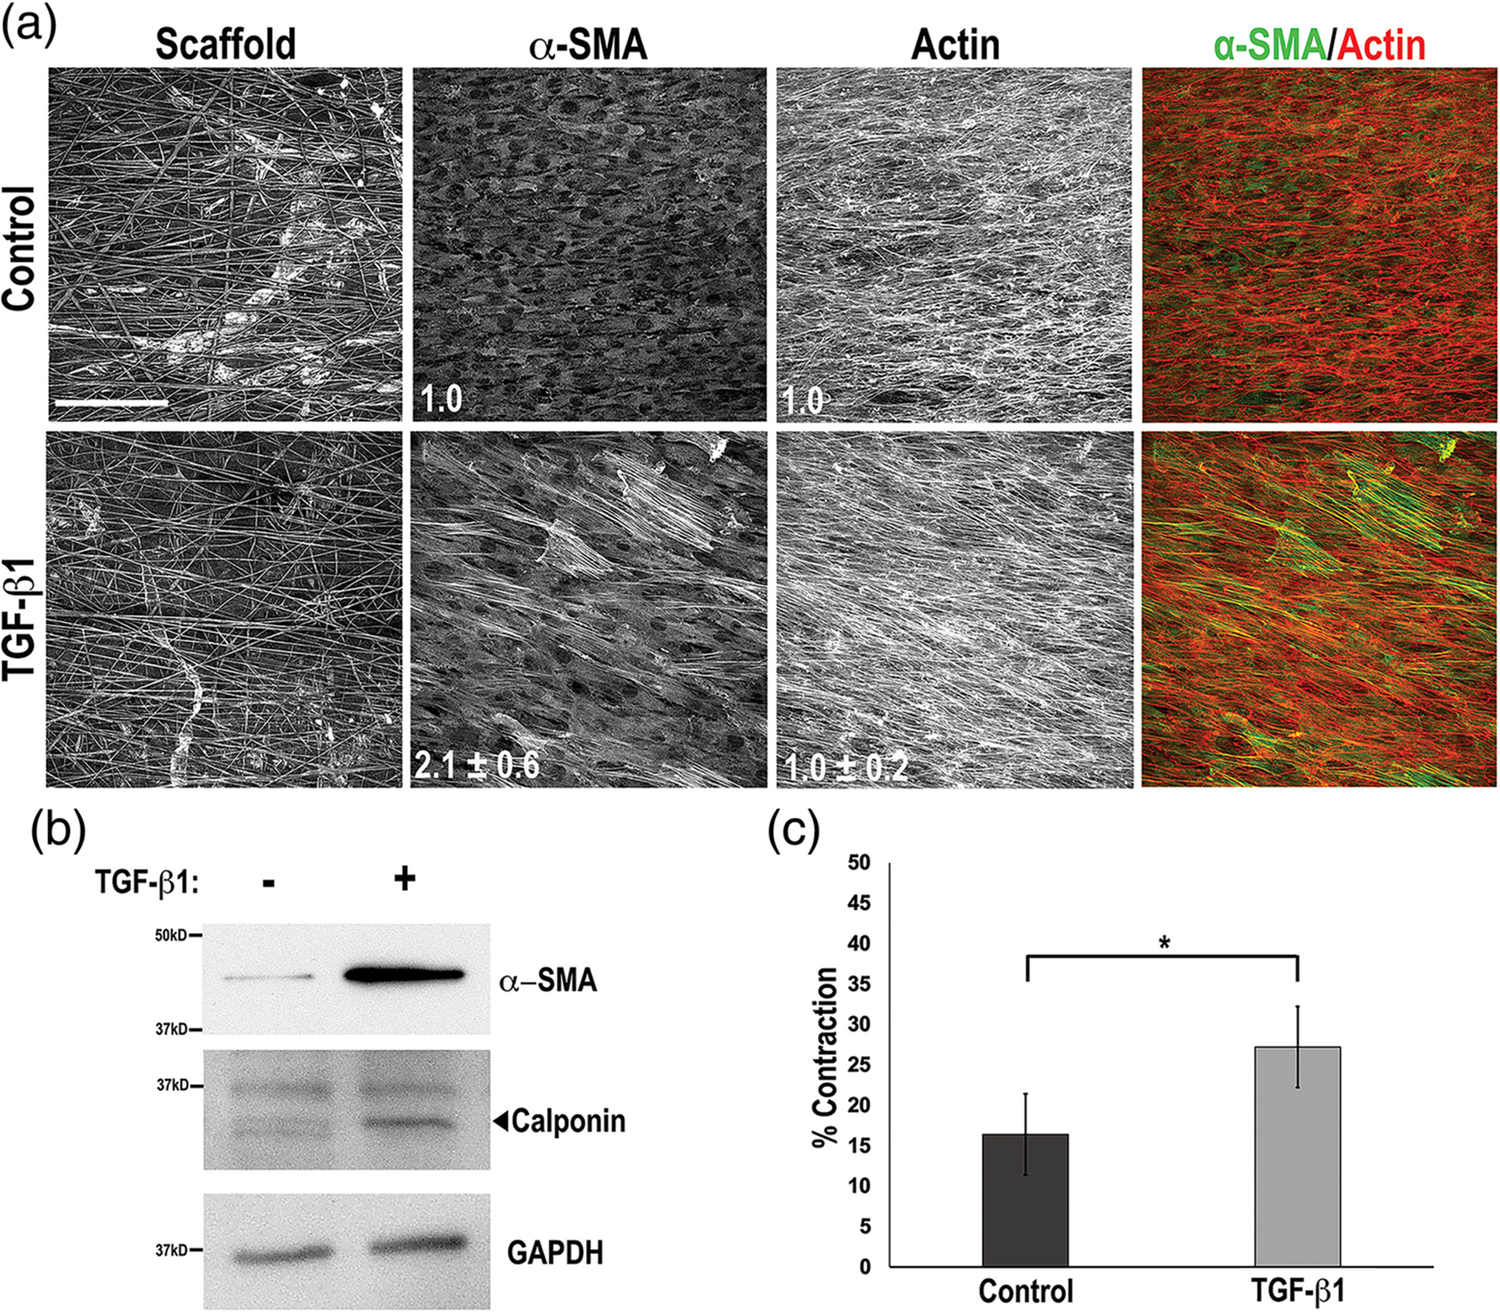
FIGURE 4.

Development of smooth muscle cell (SMC) contractile phenotype. (a) WKY3M22 rat SMCs on the aligned side of the multilayered scaffold at confluence were incubated in medium with either 2 ng/ml transforming growth factor-beta 1 (TGF-β1) (bottom) or vehicle (top) for days. Cells were fixed and stained with anti-alpha smooth muscle actin (α-SMA) antibody (green) and Texas-Red phalloidin to detect actin (red). The fold change in mean fluorescence intensities of TGF-β1-treated samples compared to control are shown in white (mean ± SE) for both α-SMA and actin (n = 3). (b) Cells grown and treated as in A were lysed in RIPA buffer. Samples were separated on a 10% polyacrylamide-SDS gel followed by immunoblotting with anti-α-SMA, anti-calponin, or anti-GAPDH antibodies. Representative blots are shown. (c) Contraction of fibrin-FN matrices containing TGF-β1-treated or control WKY3M22 SMCs was measured at 4 hr of incubation. Percent contraction was calculated and the data are expressed as mean ± SE for three experiments. *p < .05
