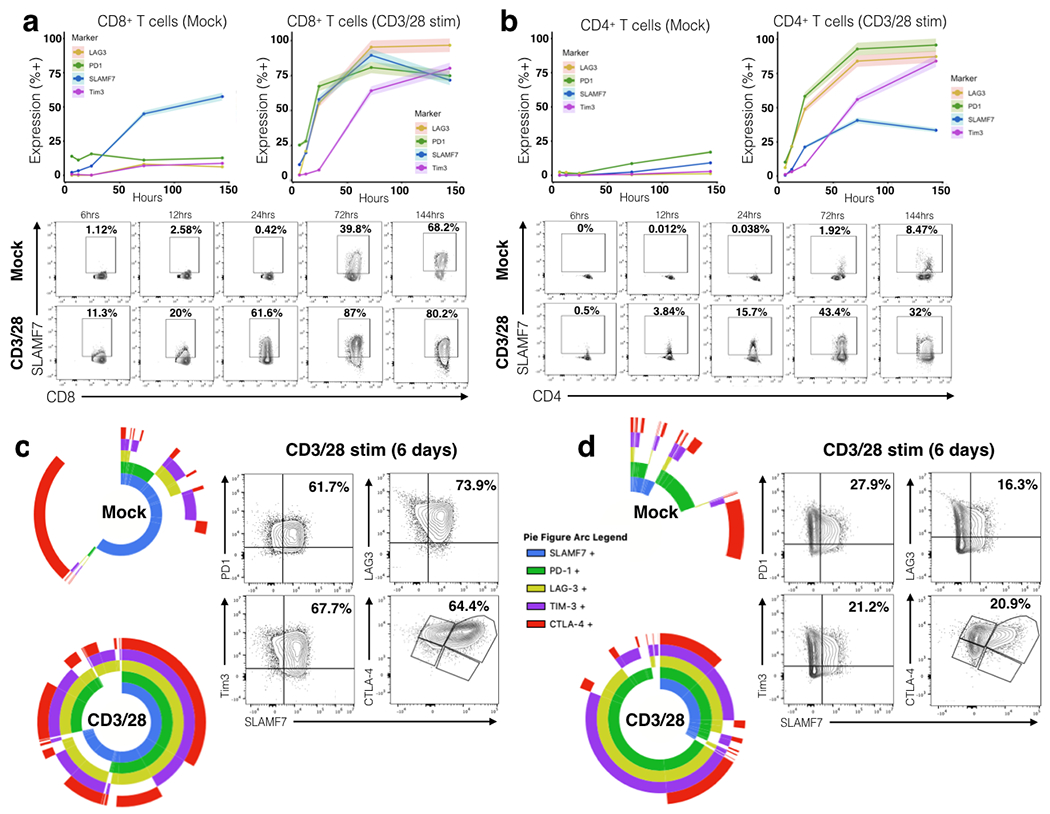
FIGURE 1. SLAMF7 is co-expressed with multiple exhaustion markers on CD3/CD28 stimulated human T cells.

(a, b) Time course of SLAMF7 and exhaustion marker expression on Mock or CD3/CD28 in vitro stimulated primary human CD8+ T cells (a) and CD4+ T cells (b). Top, exhaustion marker expression is shown as mean of two replicates of 2-4 healthy donors with the upper and lower 5% bounds of data shaded in. Bottom, representative plots of SLAMF7 expression on Mock and CD3/28 stimulated cells over time. (c, d) Left, SPICE plots showing co-expression of SLAMF7 with exhaustion markers on Mock and CD3/28 stimulated CD8+ T cells (c) and CD4+ T cells (d). SPICE plots in (c) and (d) each represent two replicate samples from two healthy donors. Right, representative biaxial plots of SLAMF7 co-expression on CD3/28 stimulated T cells after 6 days. Data is representative of 4 total healthy donors from two independent experiments.
