
FIGURE 2. SLAMF7 activation induces expression of inhibitory receptors and exhaustion promoting transcription factors in CD8+ and CD4+ T cells.
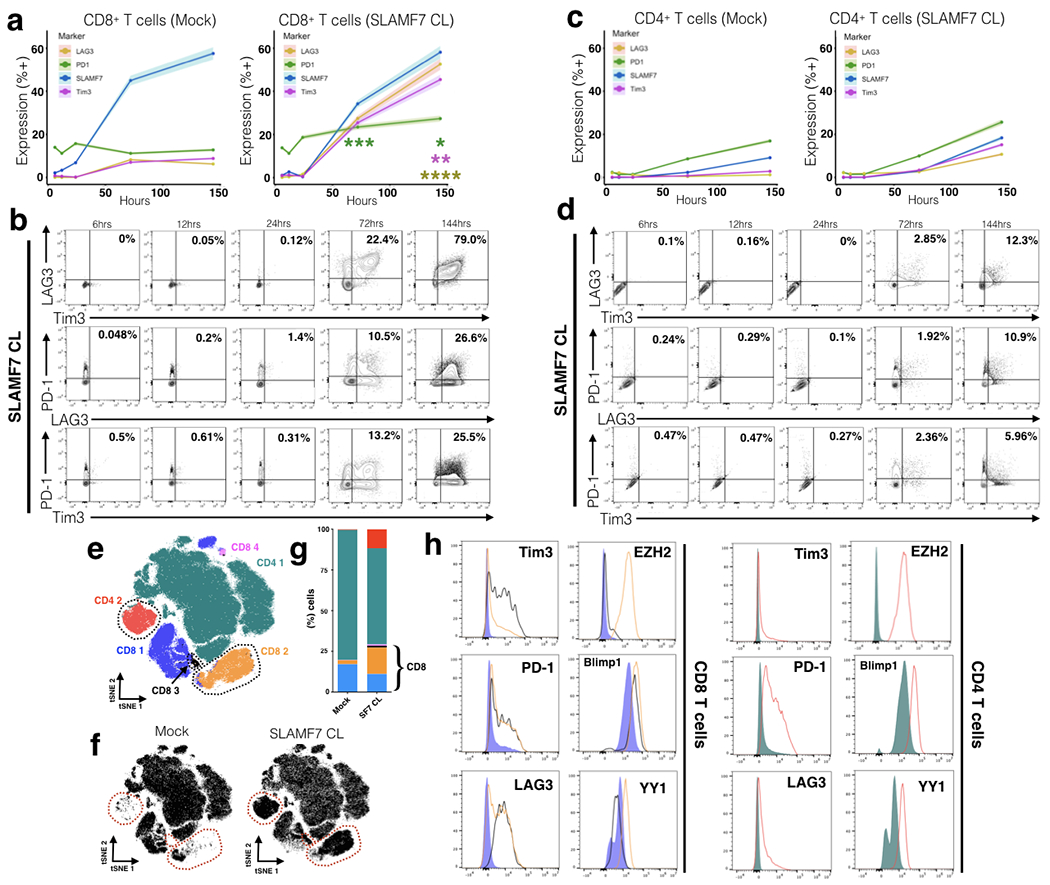
(a, b) Time course of exhaustion marker expression on CD8+ T cells in the presence or absence of in vitro SLAMF7 activation. SLAMF7 was activated by receptor cross-linking with an anti-SLAMF7 mAb. Exhaustion marker expression is shown as mean of two replicates of 2-4 healthy donors with the upper and lower 5% bounds of data shaded in (a) or as biaxial plots (b). Asterisks indicate significant differences in marker expression between Mock and SLAMF7 CL conditions at various time points and are colored by marker. (c, d) Time course of exhaustion marker expression on SLAMF7 activated CD4+ T cells shown in the same manner as (a, b). (a-d) Representative of (n=5) independent experiments with (n=11) total healthy donors. (e) FlowSOM clustering on Mock and SLAMF7 activated T cells reveals unique clusters of T cells following SLAMF7 activation. Individual cells (n=200,000) are depicted on a tSNE plot and colored according to FlowSOM clusters. Clusters only present, or greatly enriched, during SLAMF7 activation are outlined. (f) tSNE maps of T cells separated by condition with clusters only present during SLAMF7 CL outlined. (g) Cluster composition of Mock and SLAMF7 CL conditions. (h) Comparison of exhaustion markers and T cell exhaustion-linked transcription factors between various FlowSOM clusters. Histograms are colored corresponding to clusters from (e). Results in (e-h) are representative of 4 independent experiments showing similar results with a total of (n=8) healthy donors. Pooled results from (n=2) healthy donors displayed in (e-h). Groups in (i) compared using a paired student’s t-test. *p<0.05. Conditions in (a) compared by fitting a mixed model and with Sidak’s multiple comparison test. Mock results from (a) and (c) are duplicated from Figure 1.