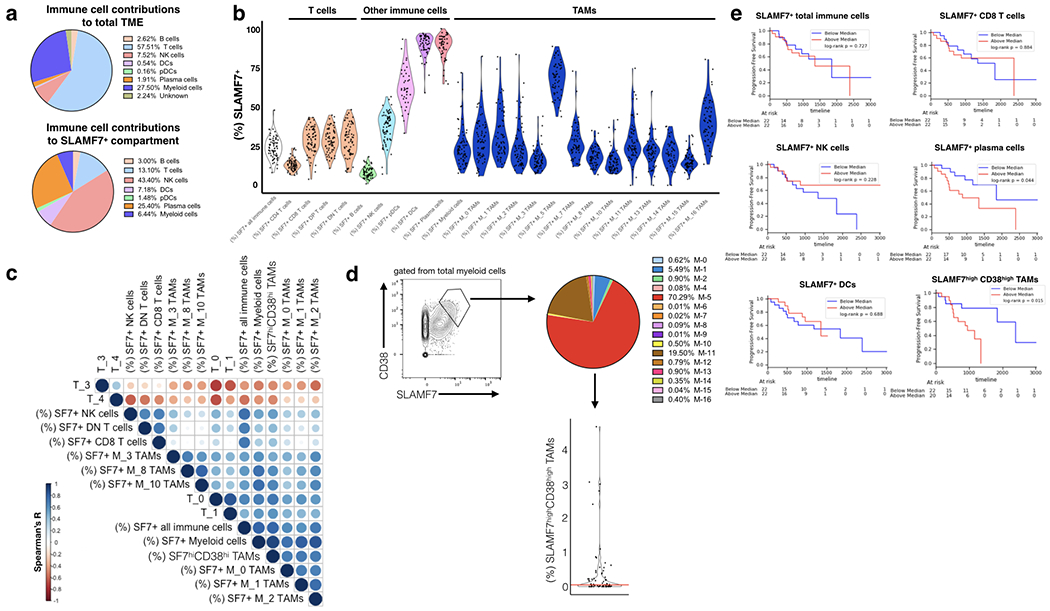
FIGURE 6. SLAMF7 expression in the ccRCC immune niche and associations with T cell phenotypes and patient survival.

(a) Top, relative contributions of various immune cell subsets in the ccRCC TME as assessed by CyTOF. Percentages are calculated from a concatenated sample of (n=73) ccRCC tumor samples using Phenograph-assigned clusters previously determine by Chevrier et al., 2017. Bottom, SLAMF7+ cells were gated out from total immune cells and contributions of various Phenograph clustered immune cell subsets was determined. (b) SLAMF7 expression across various immune cell types in the ccRCC TME. Phenograph-assigned clusters were used for immune subset identification with TAMs being further subdivided based on TAM-specific subsets identified by Chevrier et al., 2017. Each dot represents an individual patient tumor sample. (c) Correlation matrix heatmap of SLAMF7 expression on various immune cell types and frequencies of various T cell subsets. T cell frequencies are calculated as the frequency of each T cell subset out of the total T cell compartment of each patient. T cell subsets are identified by Phenograph in Chevrier et al., 2017. Spearman correlation is displayed as a circle scaled by color and size based on the magnitude of the R value. Only the top 10 positive and negative correlations are displayed. (d) Left, gating of SLAMF7highCD38high TAMs from total myeloid cells. Right, breakdown of SLAMF7highCD38high TAMs by Phenograph-determined TAM subsets. Results are from a concatenated sample containing all 73 ccRCC tumor samples. Bottom, frequency of SLAMF7highCD38high TAMs per total immune cells per patient. Red line indicates median (0.052). (e) Kaplan-Meier plots of progression free survival, with ccRCC patients stratified by high or low numbers of various immune cell subsets expressing SLAMF7. For all plots the relative frequency of SLAMF7+ cells from each immune subset out of the total immune compartment is considered. Log-rank test is used to compare groups in (e).
