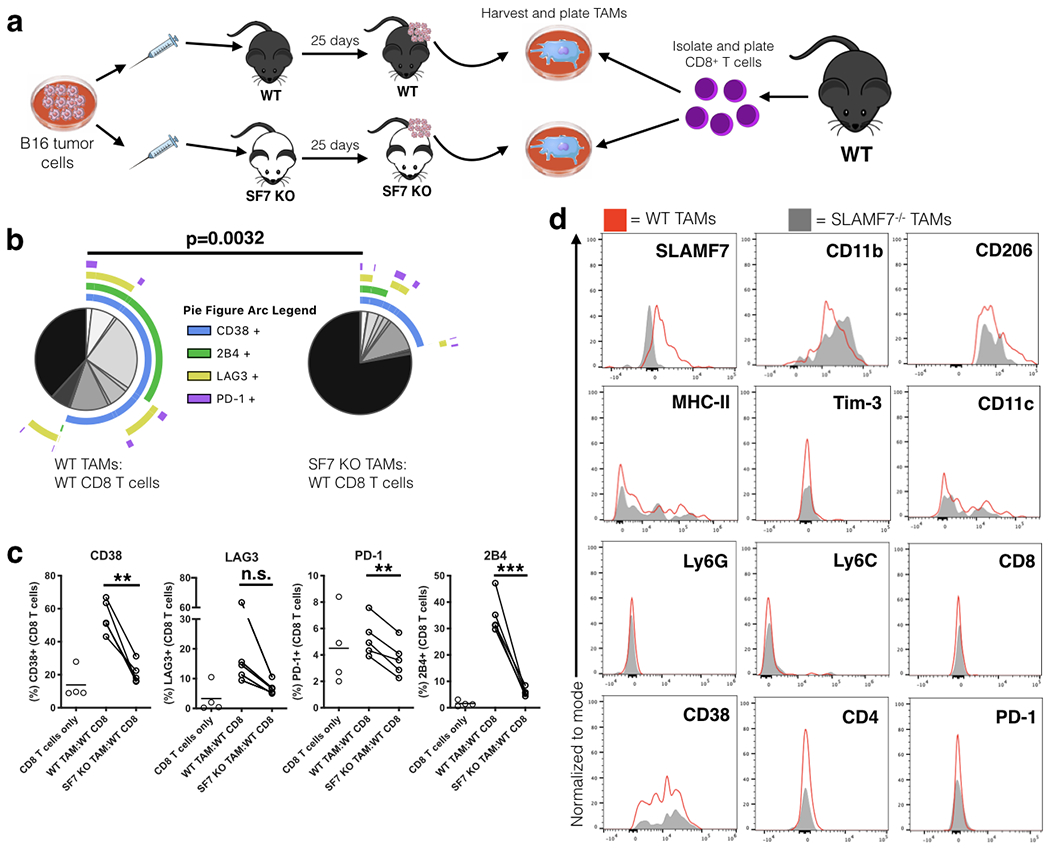
FIGURE 8. SLAMF7 expression on TAMs drives T cell exhaustion.

(a) Experimental approach used for ex vivo T cell:TAM co-culture. (b) SPICE plots of CD8+ T cells co-cultured with TAMs for 6 days (n=5); plots show response from all samples combined. (c) Changes in expression of exhaustion markers on CD8+ T cells from co-culture experiment (n=5). Groups containing CD8+ T cells and TAMs compared using a paired student’s t-test. (d) Comparison of various markers on TAMs from B16-F10 tumors grown in WT and SLAMF7−/− mice. Results from (b-d) are representative of a single experiment using TAMs pooled from (n=4) mice per genotype and CD8+ T cells from splenocytes of (n=5) WT, non-tumor bearing mice. n.s., not significant; **p<0.01; ***p<0.001.
